Image Recognition Accuracy Study
Who Has the Best Image Recognition Engine?
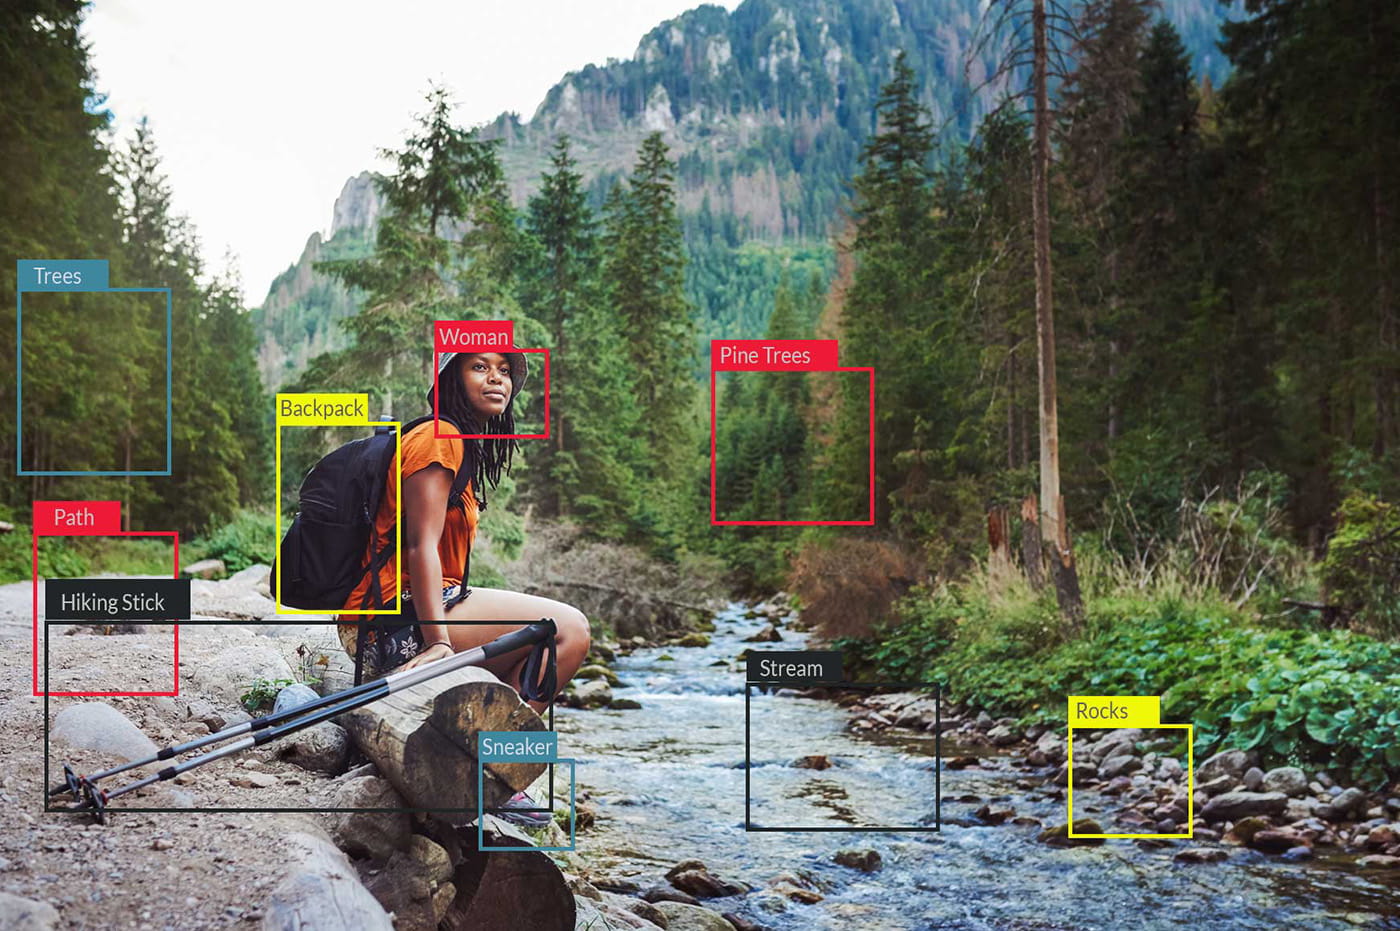
One of the hottest areas of machine learning is image recognition. There are many major players investing heavily in this technology, including Microsoft, IBM, Google, and Amazon. But which one does the best job? That is the question that we'll seek to answer with this study.
Engines and Methodology
Image recognition engines covered in this study:
- Amazon AWS Rekognition
- Google Vision
- IBM Watson
- Microsoft Azure Computer Vision
In addition, we had three users go through and hand-tag each of the images we used in this study. The total number of images used was 2,000 broken into four categories:
- Charts
- Landscapes
- People
- Products
The total number of tags each image recognition engine returned varied as follows:
Our research team at Perficient Digital used two different measures to evaluate each engine:
- How accurate the tags were from each of the image recognition engines (for 500 images). We’ll call this the “Accuracy Evaluation.”
- Whether the tags from the image recognition engine are the best match for describing each image (for 2,000 images). This is referred to as the “Matching Human Descriptions Evaluation.”
If you want to see how we collected the data and did the analysis, please jump down to the bottom of this post to see a detailed description of the process used.
Let's dig in!
We evaluated the accuracy of the engines across 500 images.
1. Image Recognition Engine Tag Accuracy
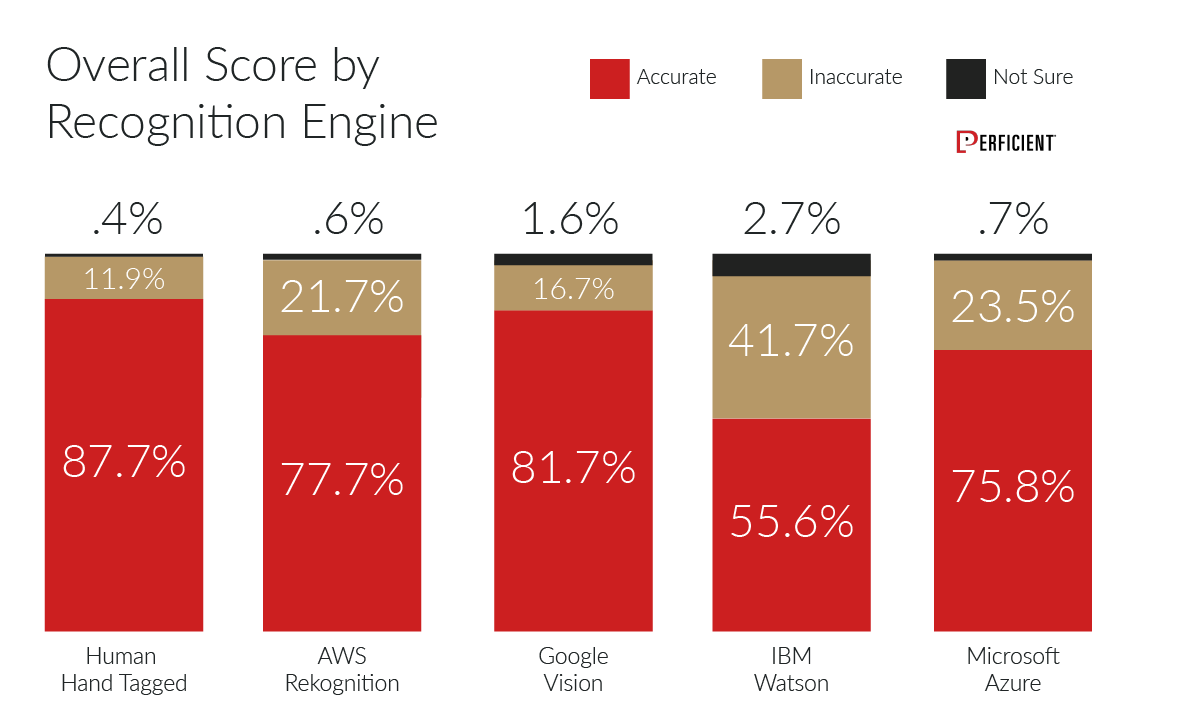
For each of the 500 images in the Accuracy Evaluation part of the study every tag from the image recognition engines was evaluated on whether or not it was accurate. This was a basic "yes, no, or I'm not sure" decision (only 1.2% of tags were marked "not sure").
The distinction here is that a tag could be judged to be accurate, even if it was one that a human would not be likely to use in describing the image. For example, a picture of an outdoor scene might get tagged by the engine as "panorama," and be perfectly accurate, but still not be one of the tags a user would think of to describe the image.
With that in mind, here is the summary data with the overall score for each engine, across all of the tags they returned:
The clear winner here is Google Vision, with Amazon AWS Rekognition coming in second.
Confidence Levels
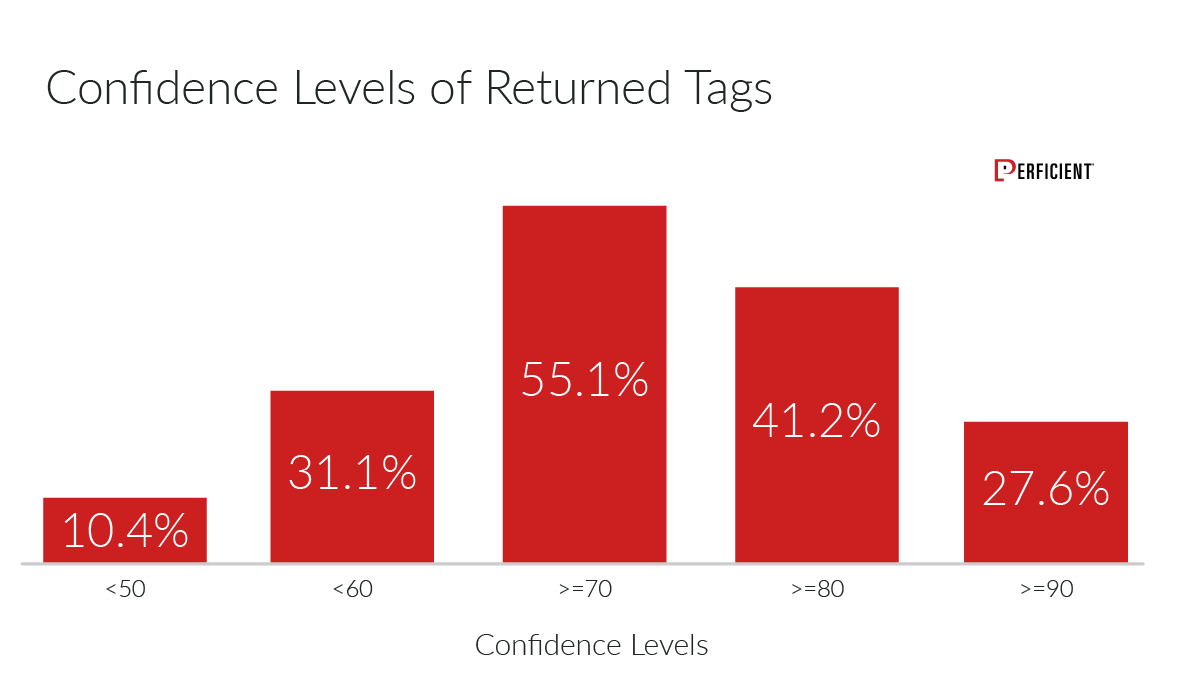
The above scores are across all tags returned by each engine. However, each engine also returns a score on the confidence level they have with each tag. This enables it to return tags that are quite a bit more speculative. Here is the data showing a summary of confidence level scores each engine provided across all engines:
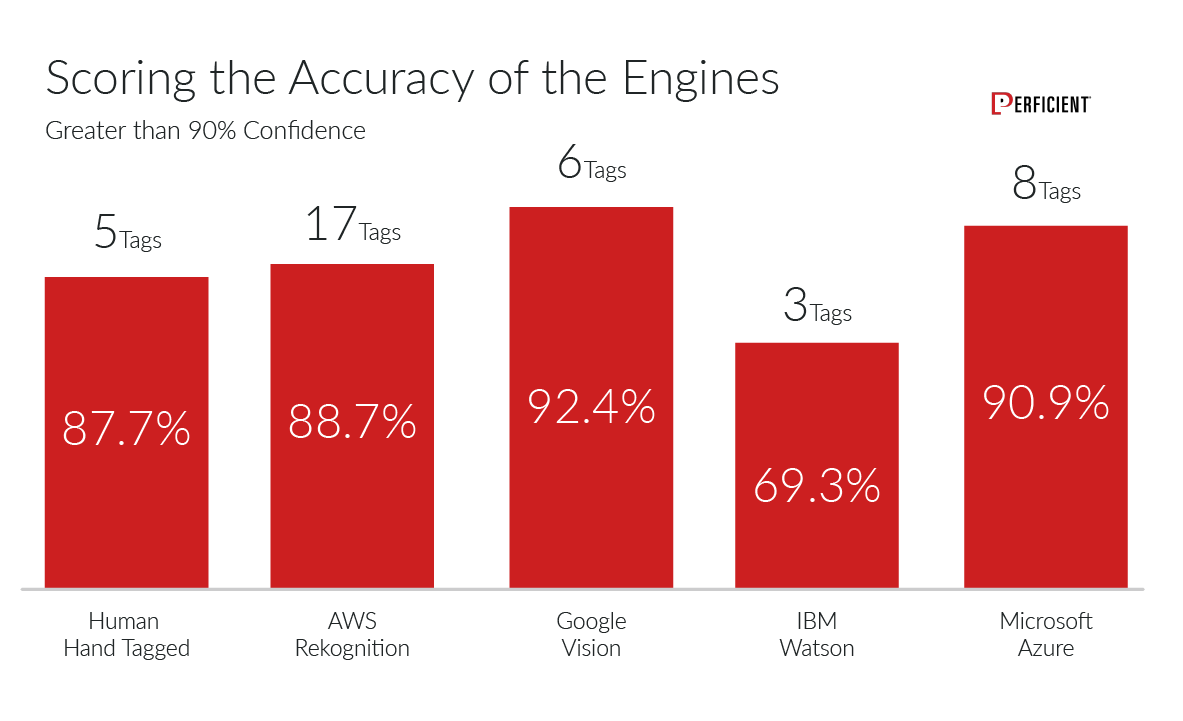
It's interesting to look more closely at images that the engines feel they have a very high degree of confidence about. Here is a look at all the images where the engines have a 90% or higher confidence level:
What's fascinating about this data is that on a pure accuracy basis, three of the four engines (Amazon, Google, and Microsoft) scored higher than human tagging for tags with greater than 90% confidence.
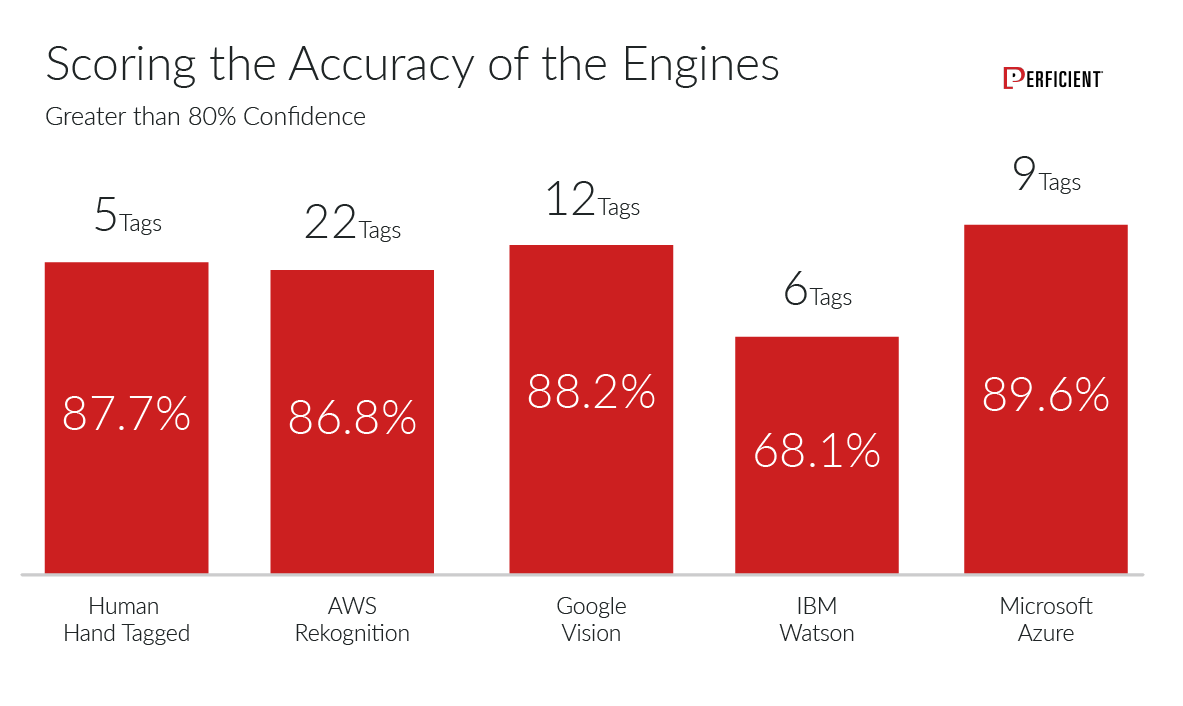
Let's see how this varies when we take the confidence level down to 80% or higher:
At this level, we see that the scores for 'human hand tagged' is basically equivalent to what we see for Amazon AWS Rekognition, Google Vision, and Microsoft Azure Computer Vision.
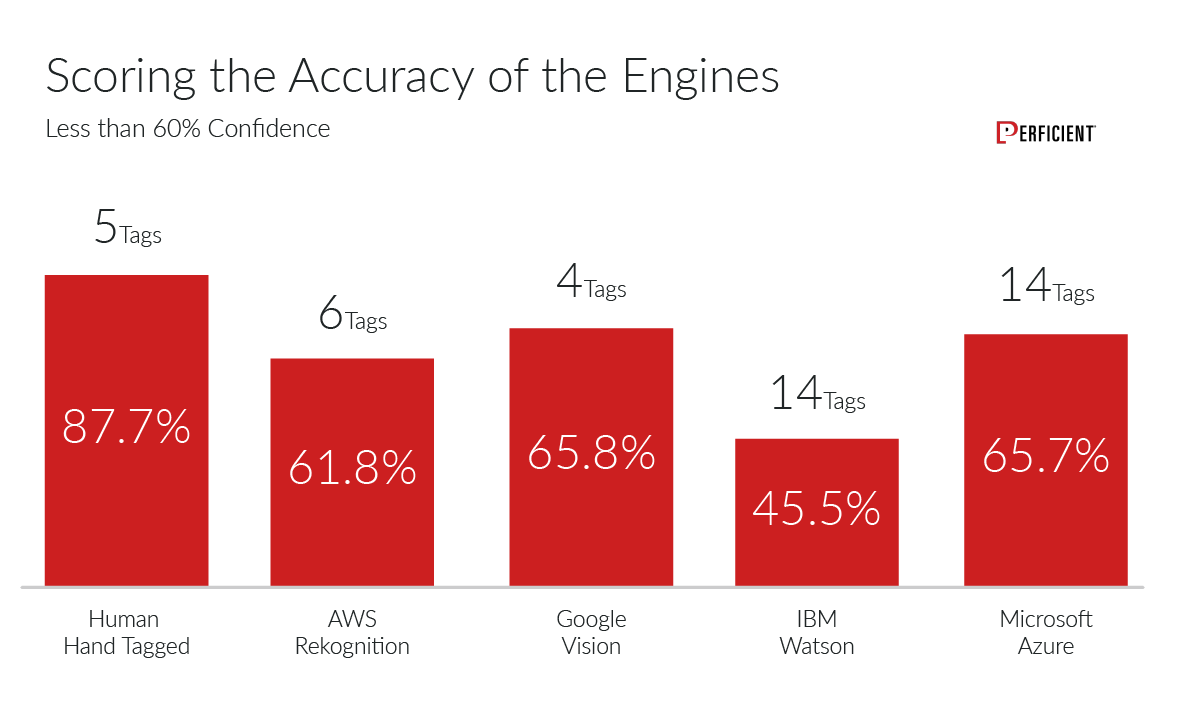
One would expect that the tags that were given a low confidence level would be lower in accuracy, and that proves to be case:
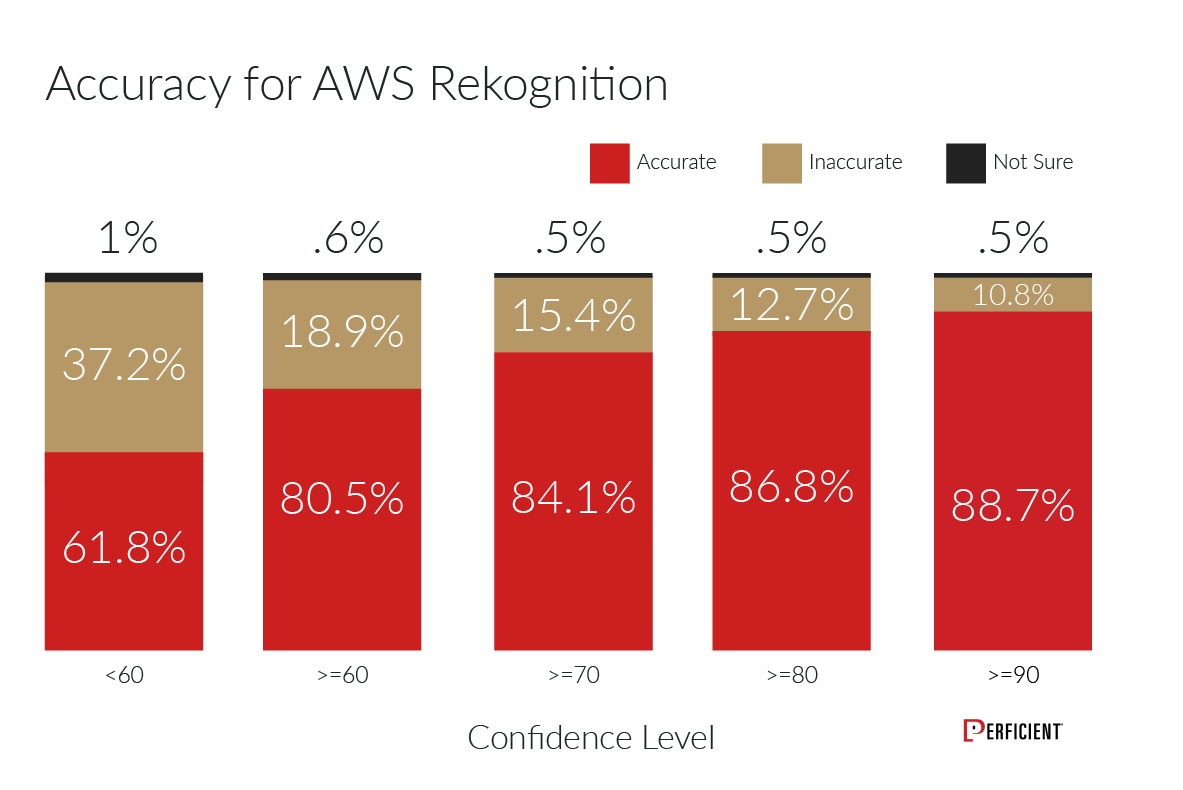
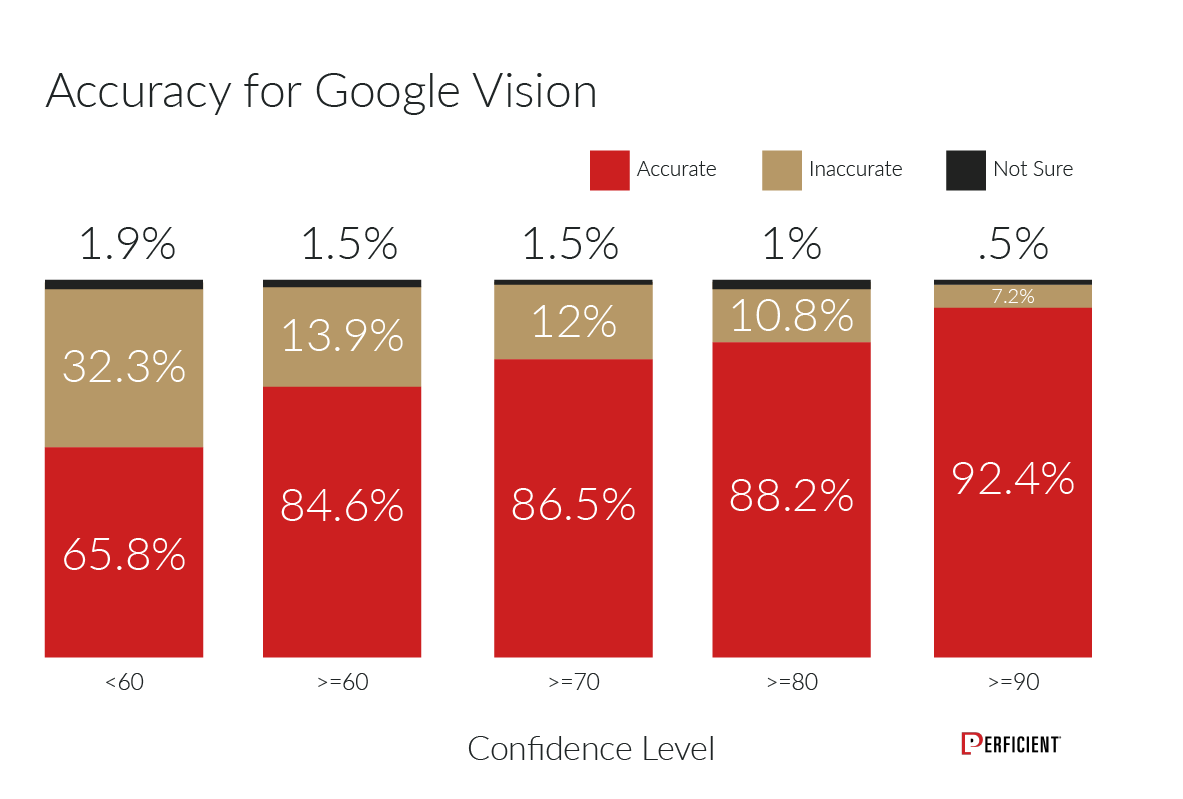
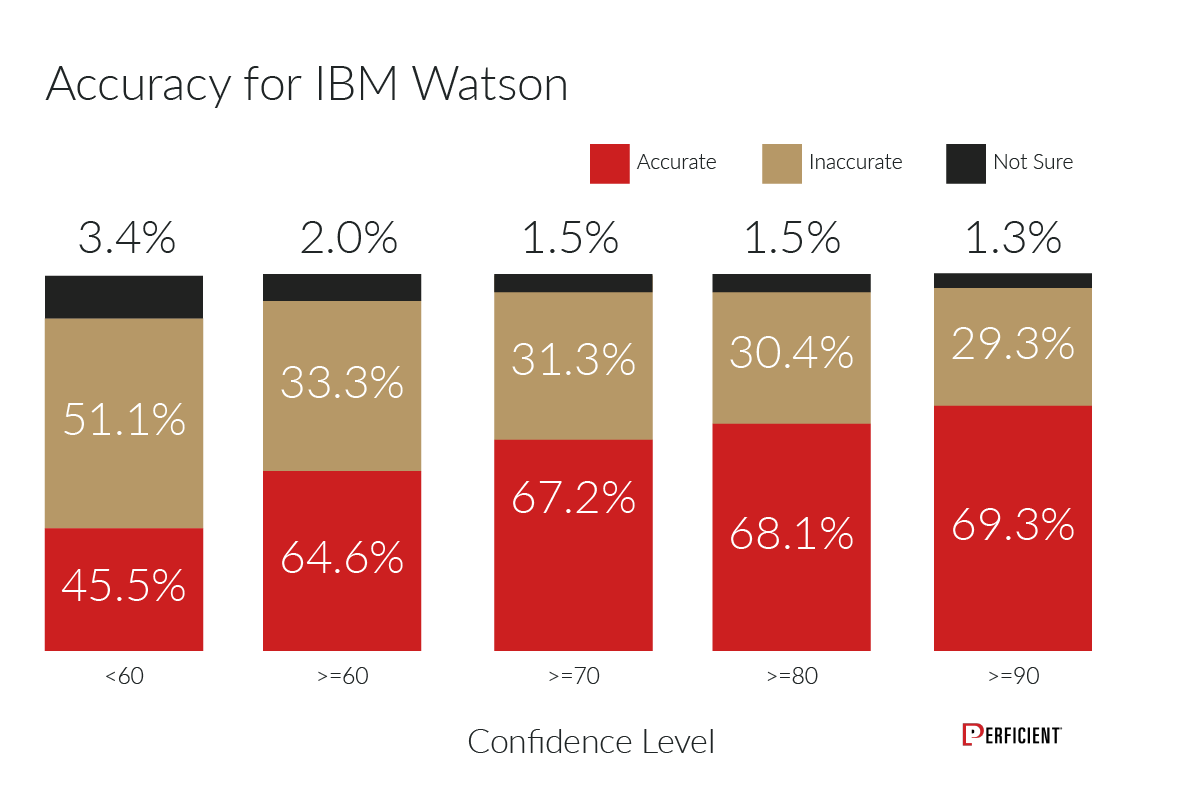
For the next few charts we'll take a look at the accuracy by image recognition engine across many classes of confidence levels.
Amazon AWS Rekognition:
Google Vision:
IBM Watson:
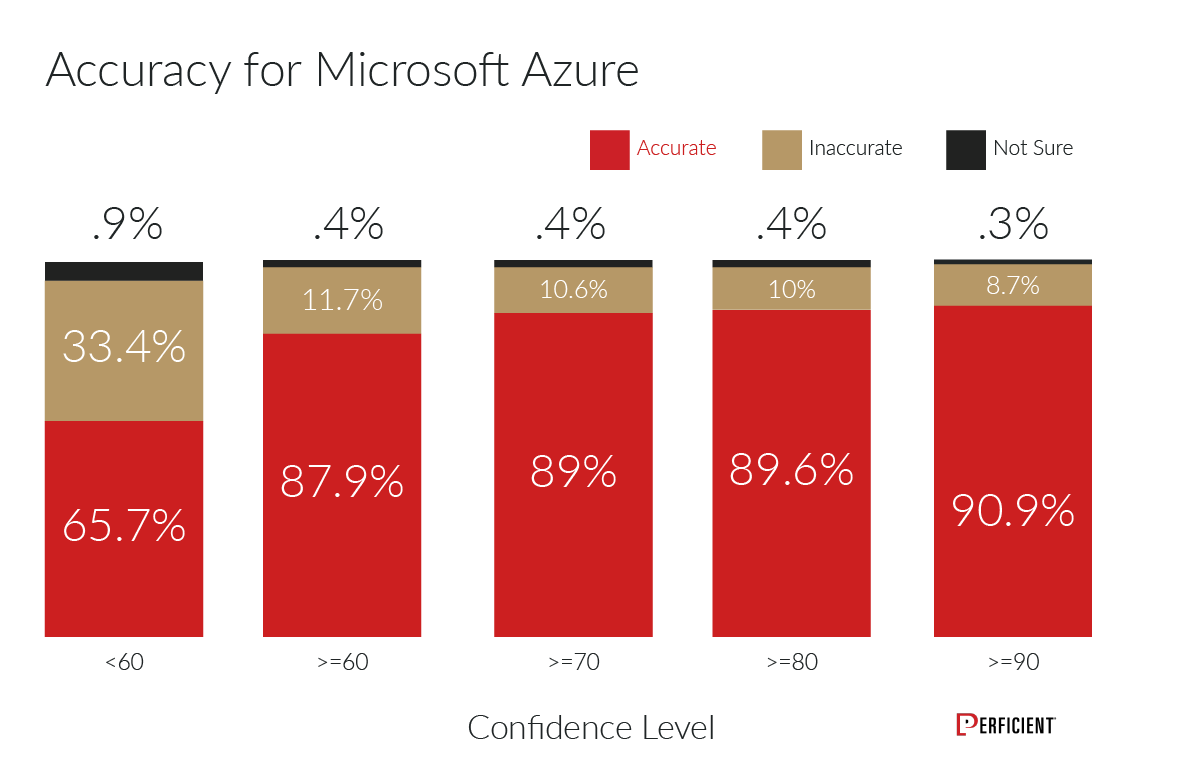
Microsoft Azure Computer Vision:
Across all engines we can see that they do significantly better with the tags that they have assigned higher confidence scores to.
2. How Well Do the Image Recognition Engines Match Up With What Humans Think?
The difference in the Matching Human Descriptions Evaluation is that we presented to users the top five highest-confidence tags provided by each engine for each image without telling them which image recognition engine they were from.
We then asked users to select and rank the top five tags that they felt best described the images. We did this across 2,000 total images. Unlike the prior data set, the focus here is on best matching what a human thinks. The goal of this evaluation was to see which of the engines came closest to doing that.
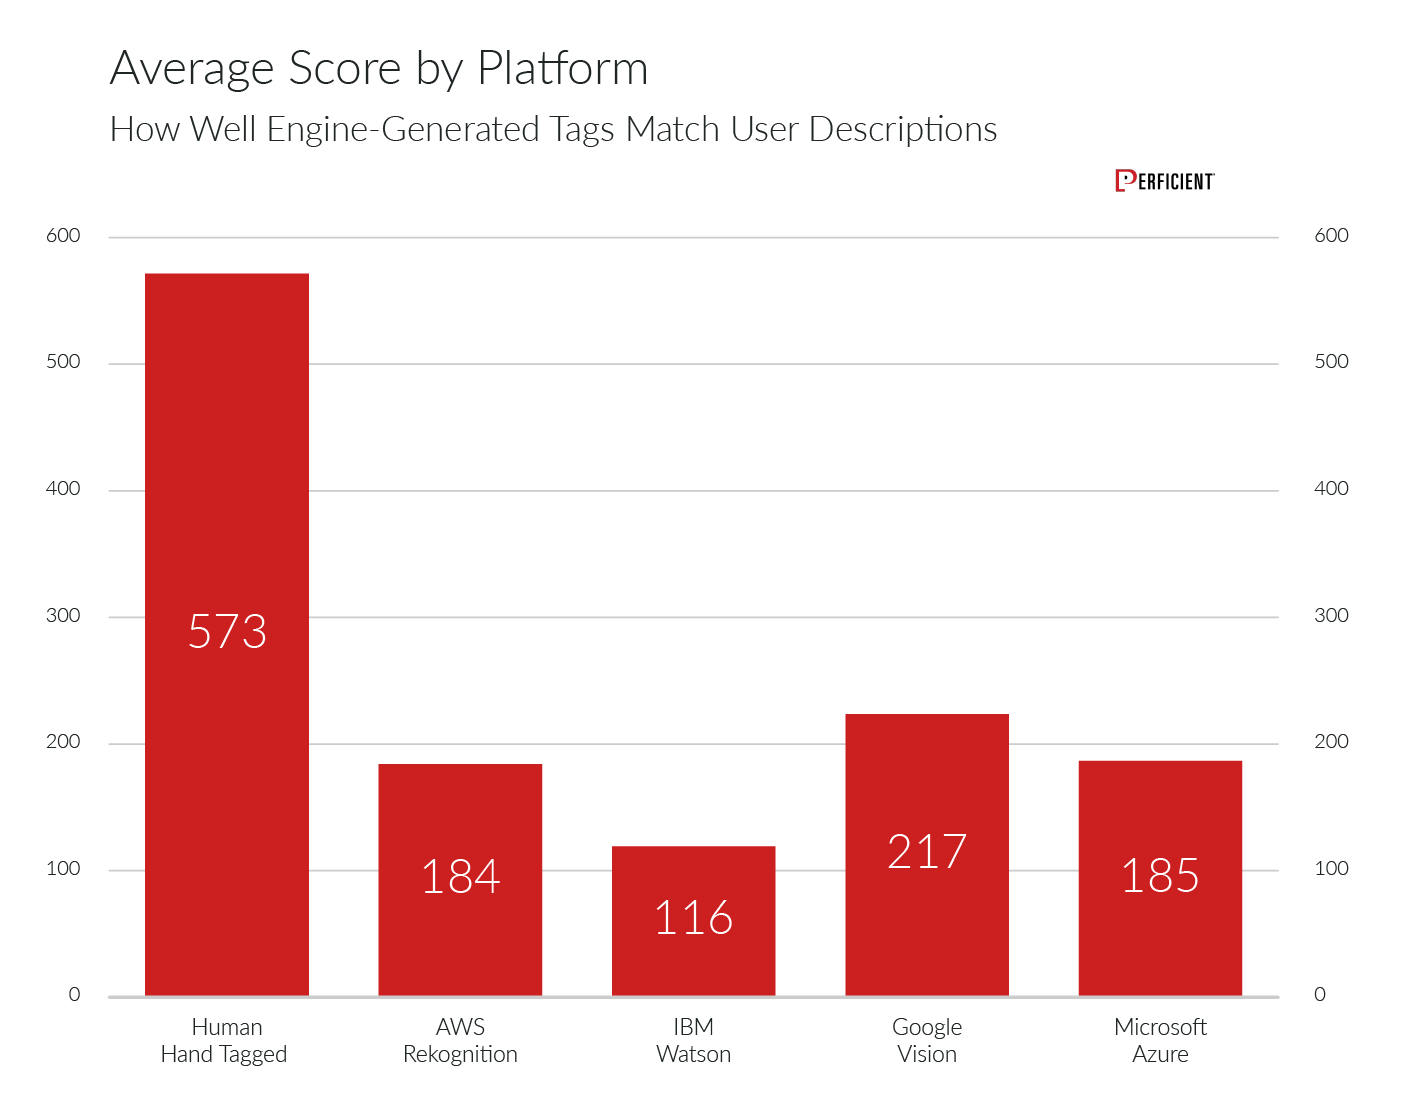
For the data, let's start with the average score by platform, in aggregate:
As you can see, the 'human hand-tagged' images score far higher than any of the engines. This is to be expected, as there is a clear difference between a tag being accurate, and a tag being what a human would use in describing an image.
The gap between the engines and humans here is quite large. That noted, the clear winner among the engines was Google Vision, but human hand tagged results were picked far more often than results from any of the engines.
In summary, humans can still see and explain what they are seeing to other humans better than machine APIs can. This is because of several factors, including language specificity and a greater contextual knowledge base The engines often focus on attributes which are not of great significance to humans, so while these are accurate, humans are more likely to describe what they feel makes the image unique.
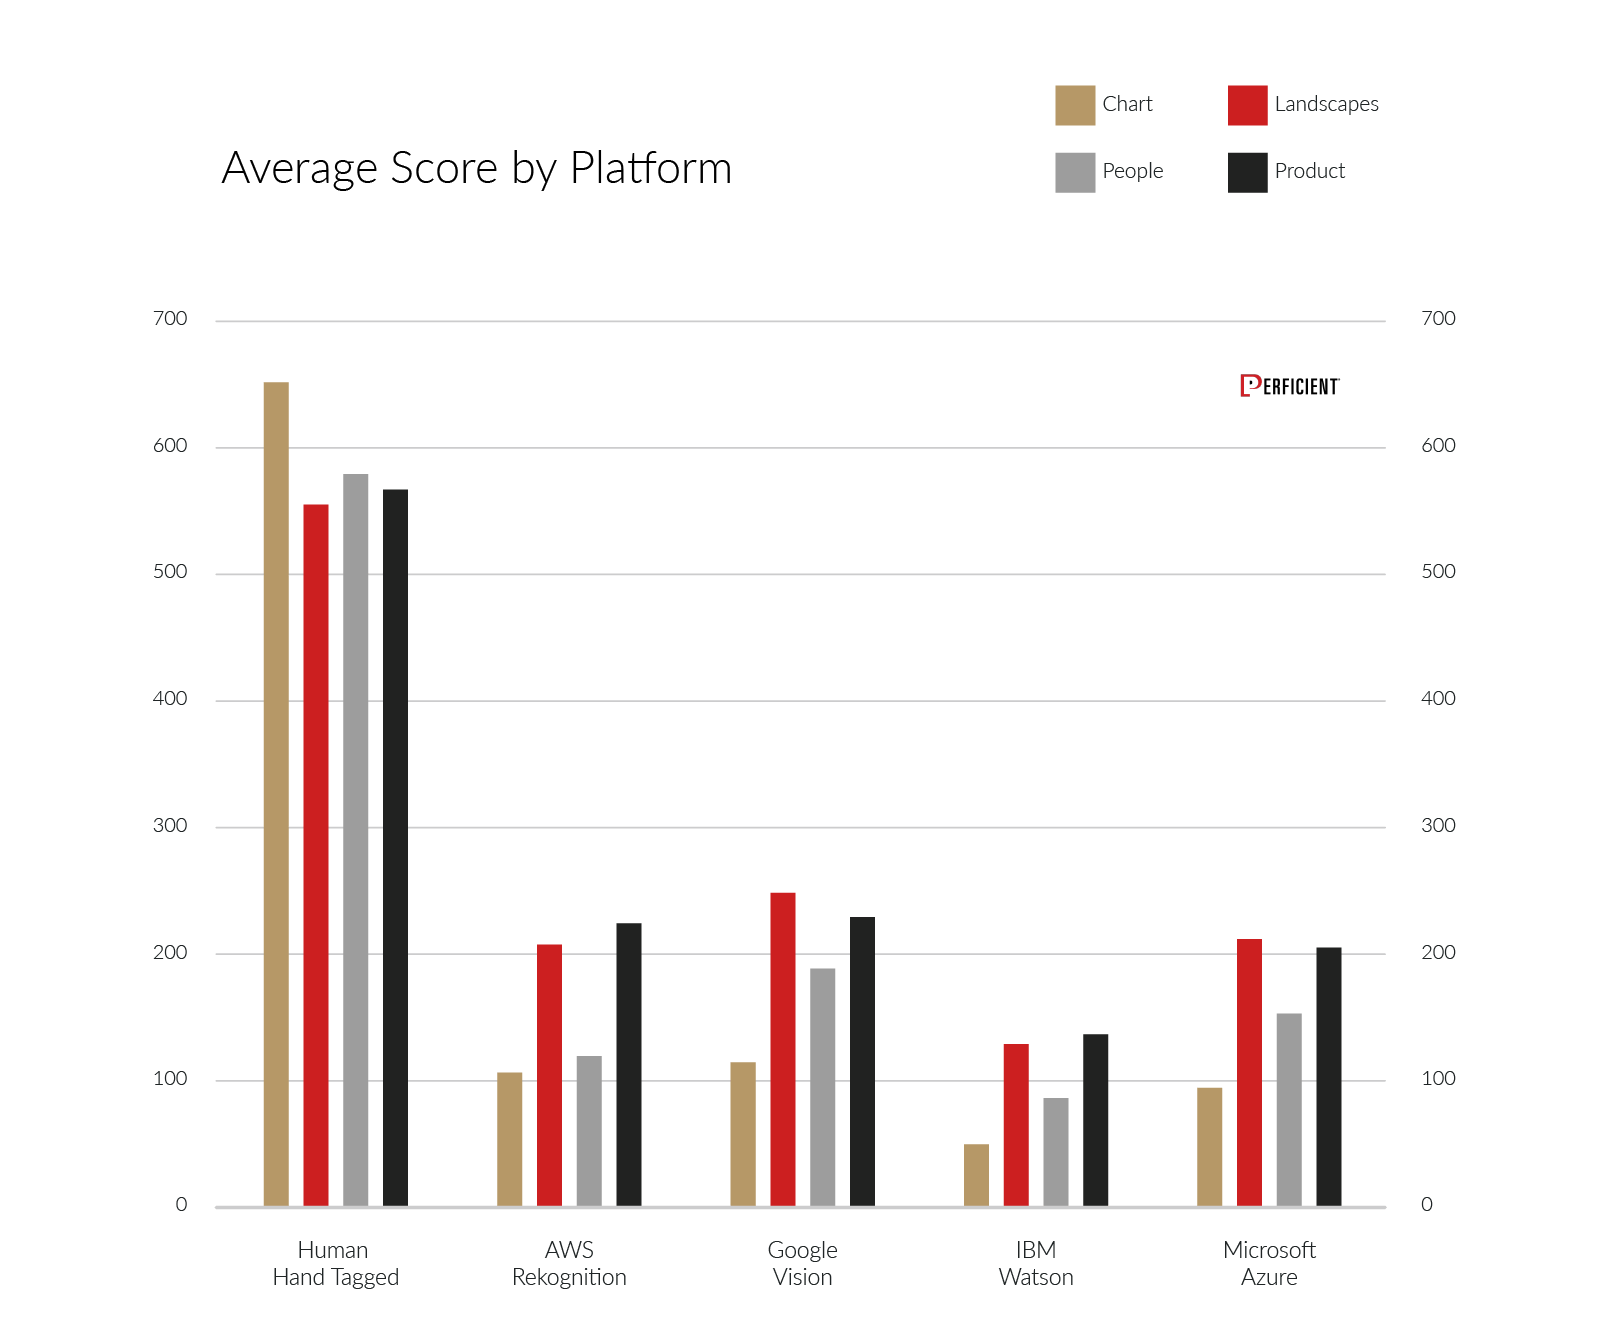
Our next chart gives us the view of the score broken out by category of image types:
The breakout by categories is interesting. Once again, the human tags are by far the most on target in each category. Google Vision wins three of the four categories, with Amazon barely edging them out in the products category.
Three of the four engines scored higher than human tags when the engine tags had a confidence level of 90% or greater.
3. Vocabulary of the Image Recognition Engines
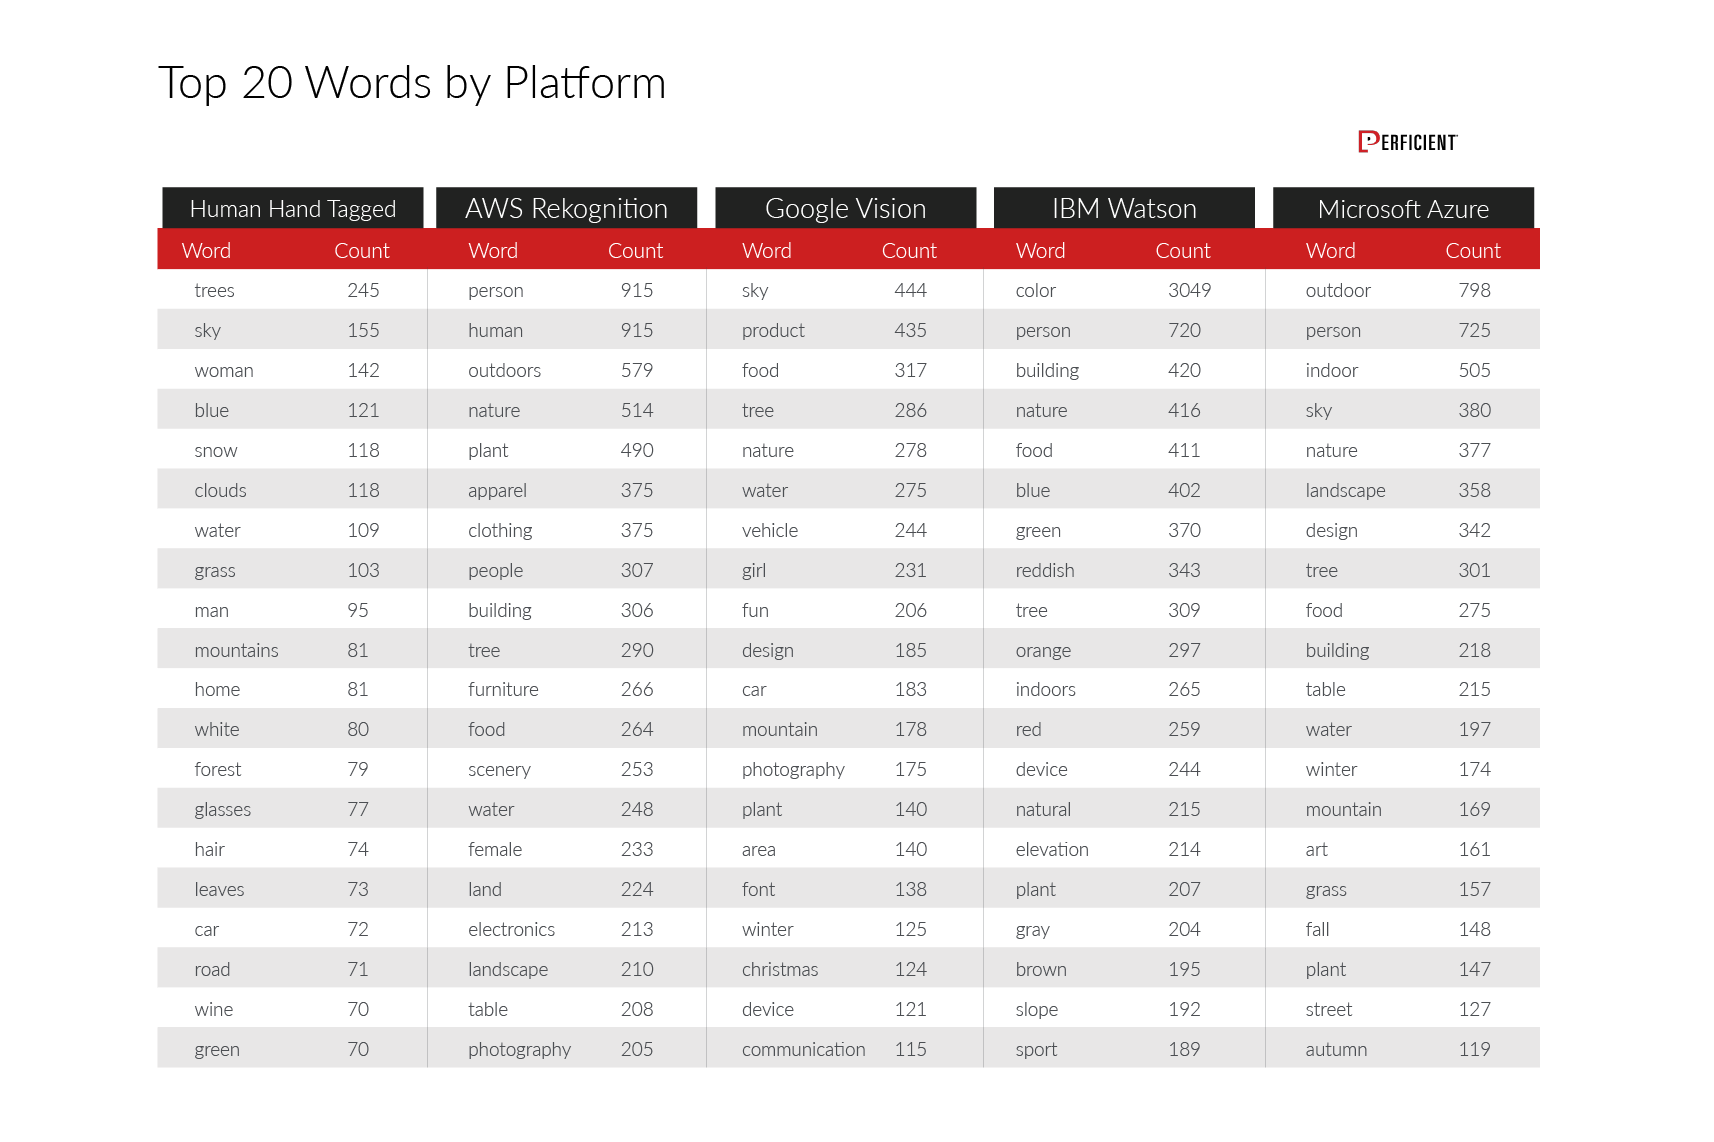
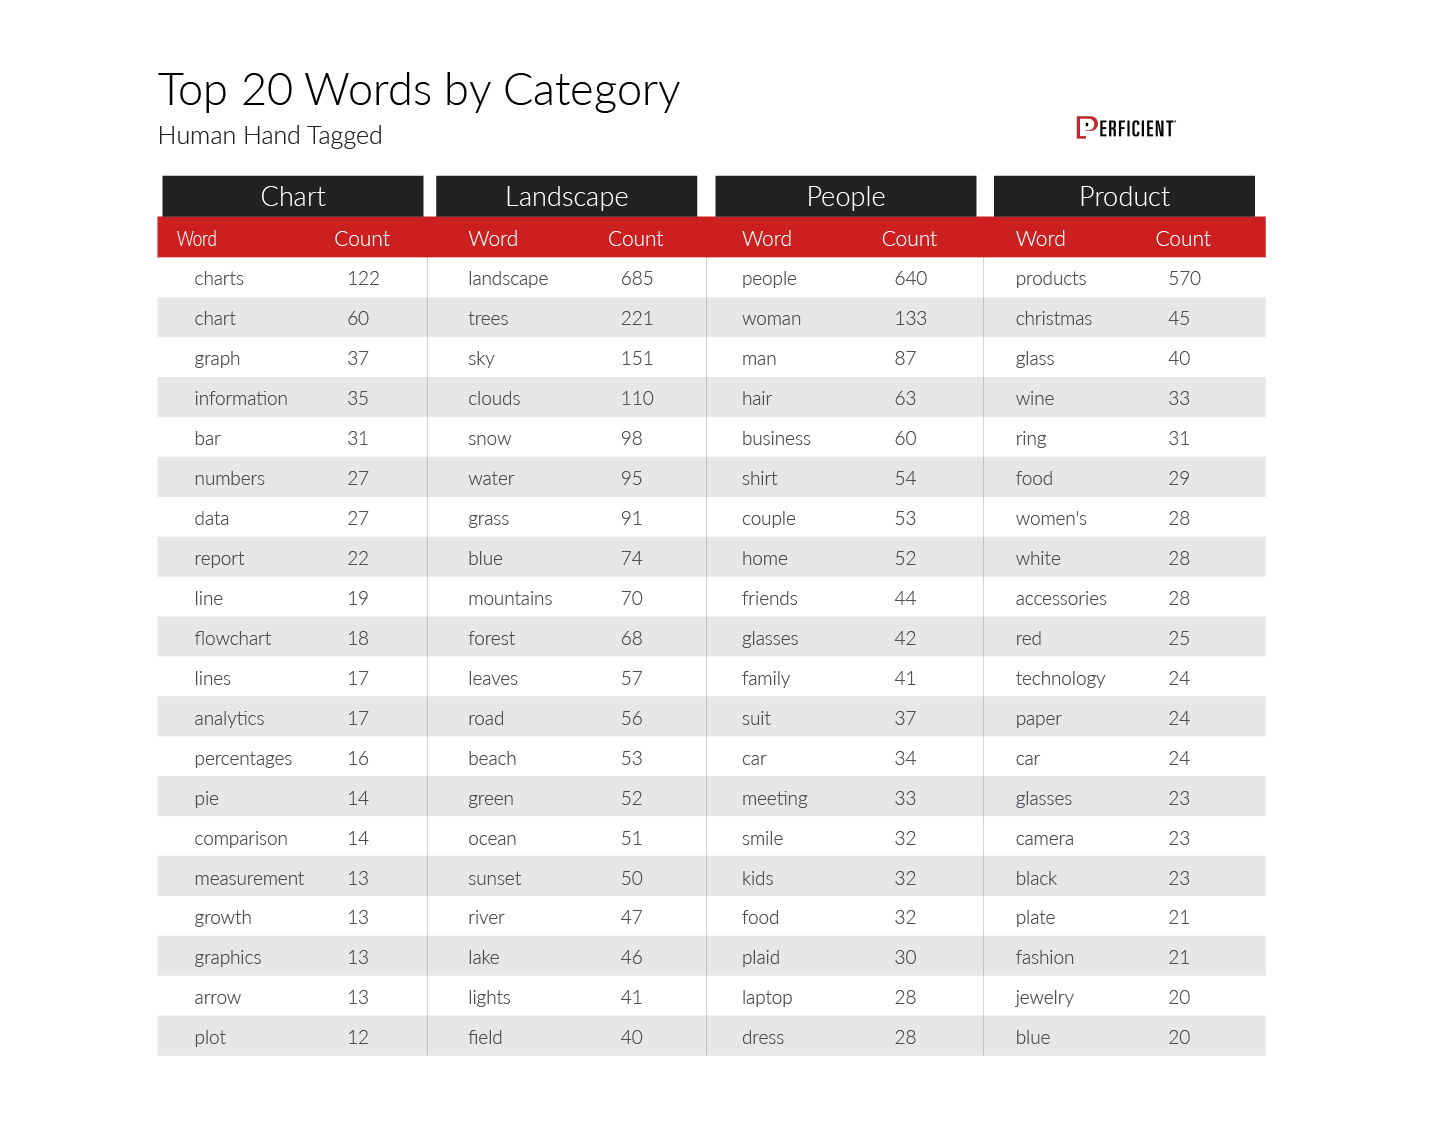
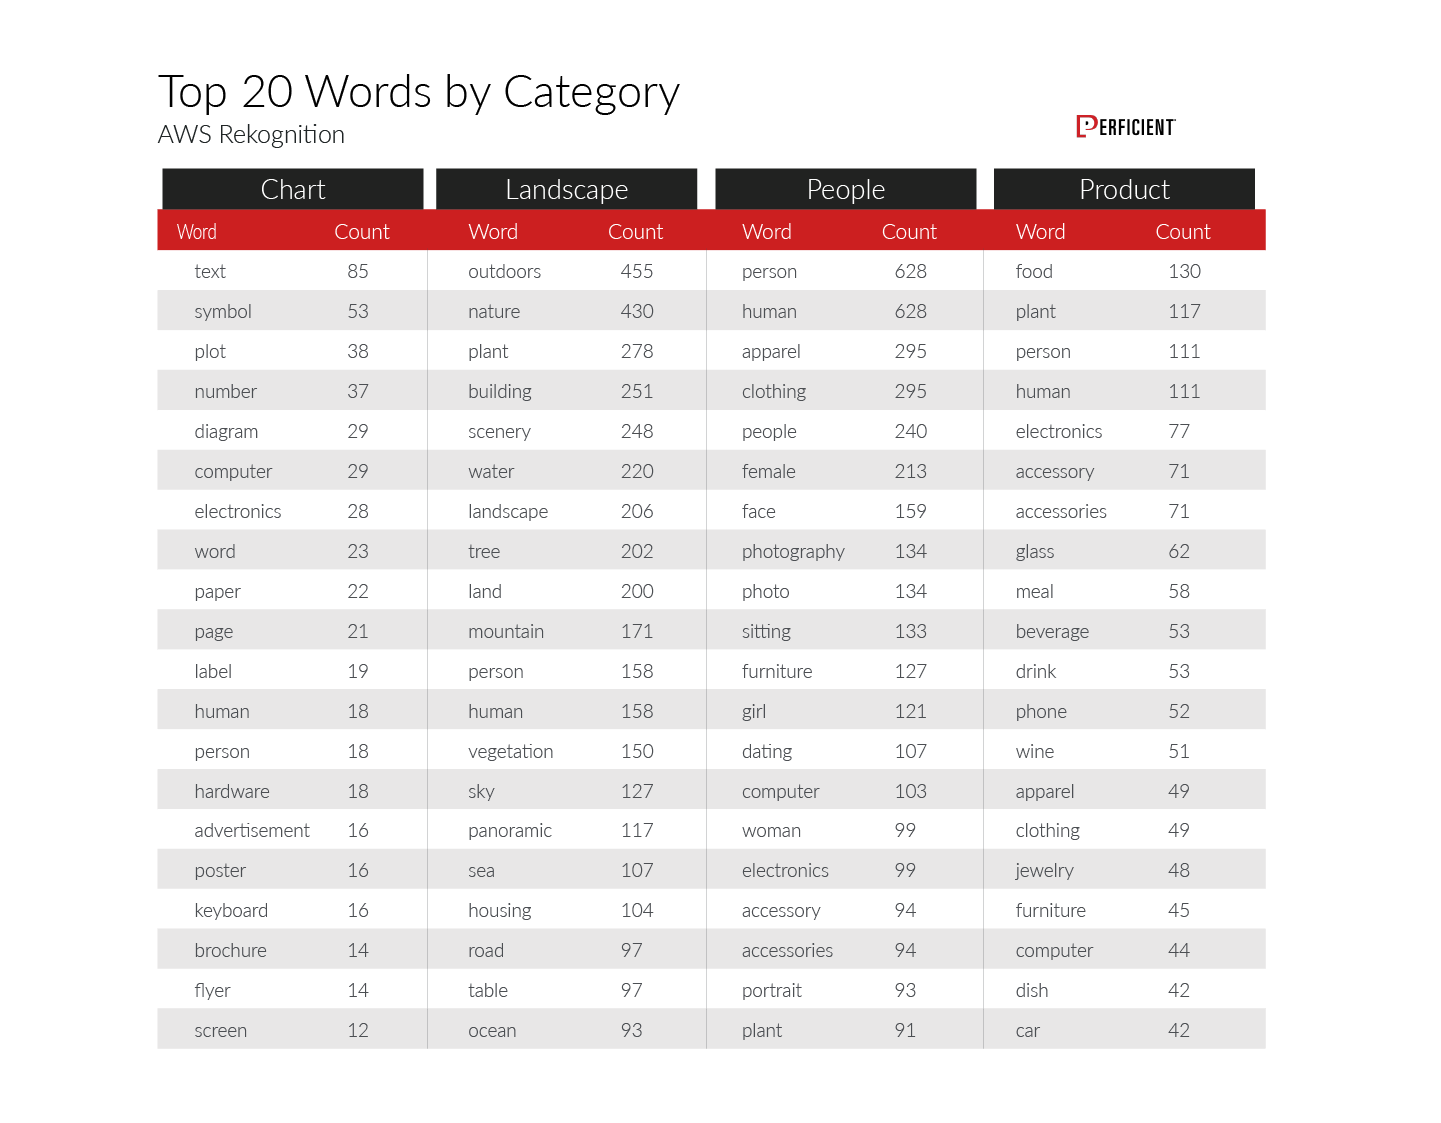
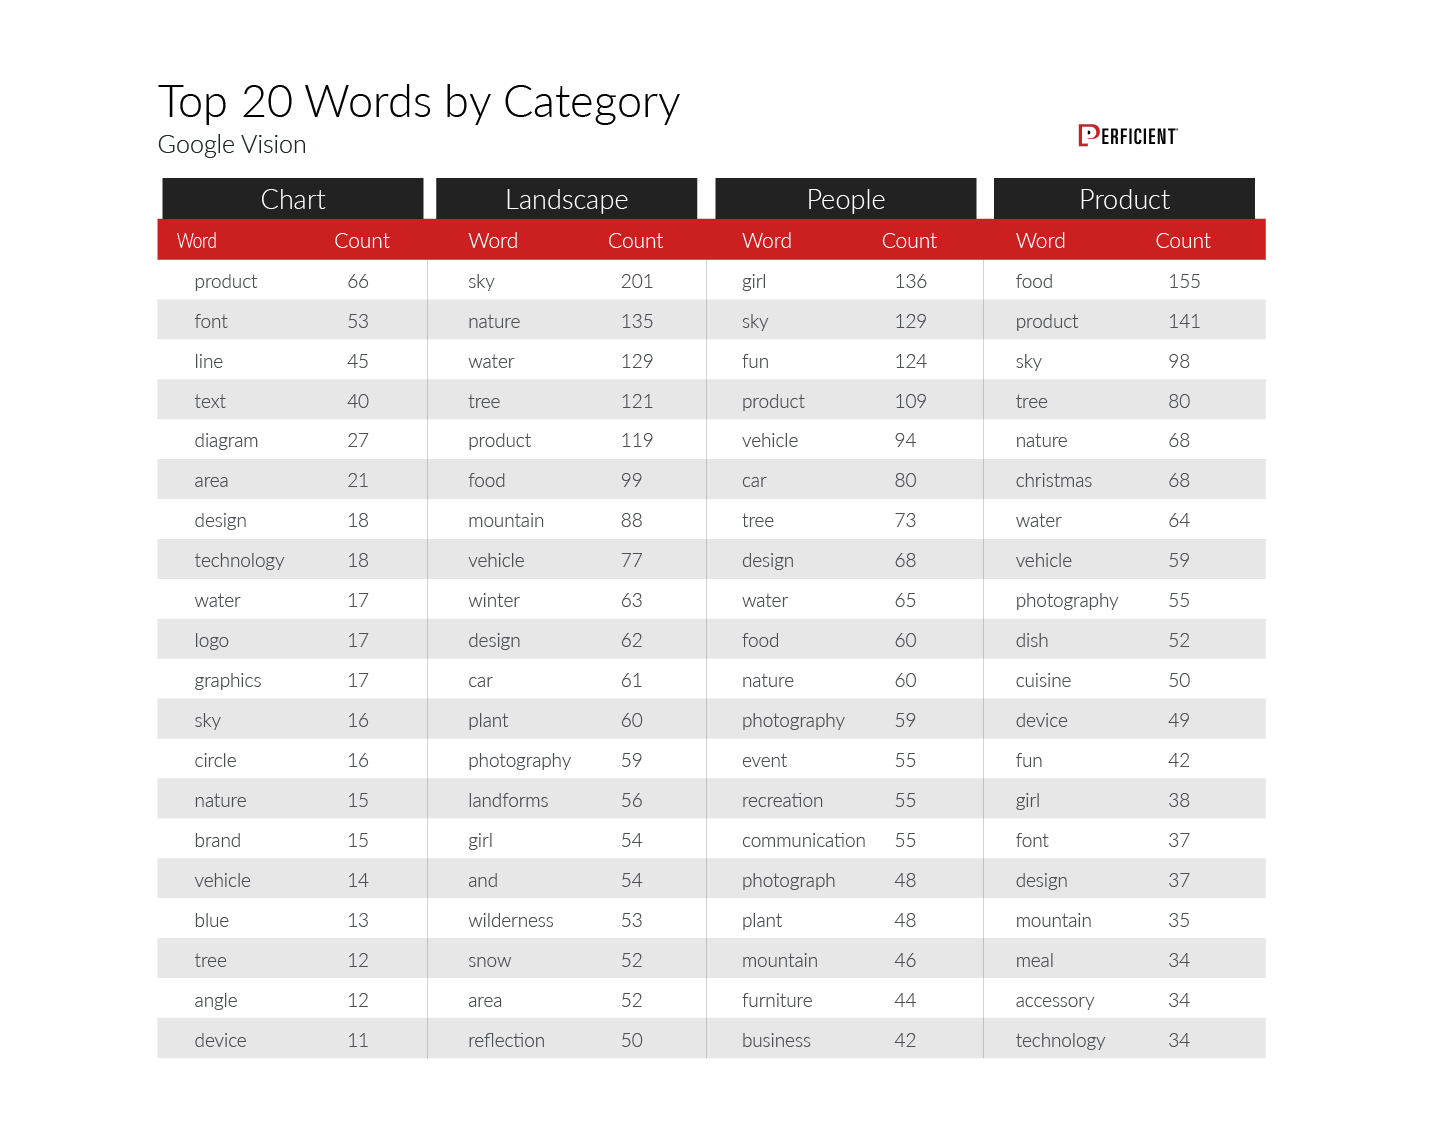
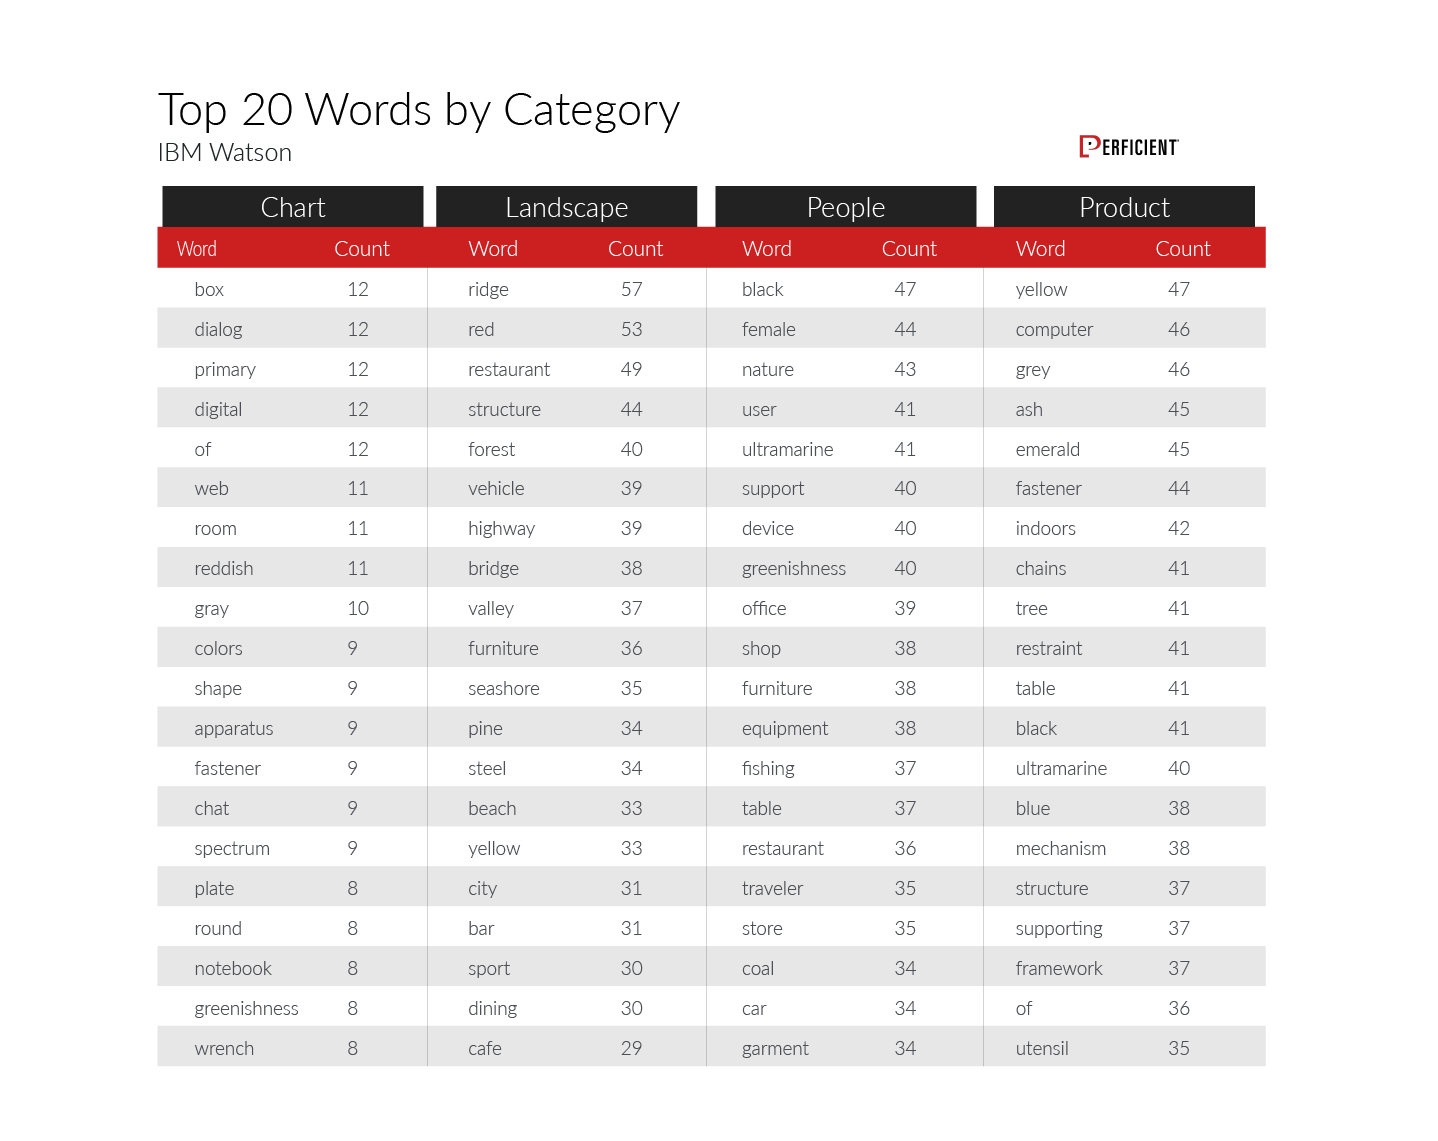
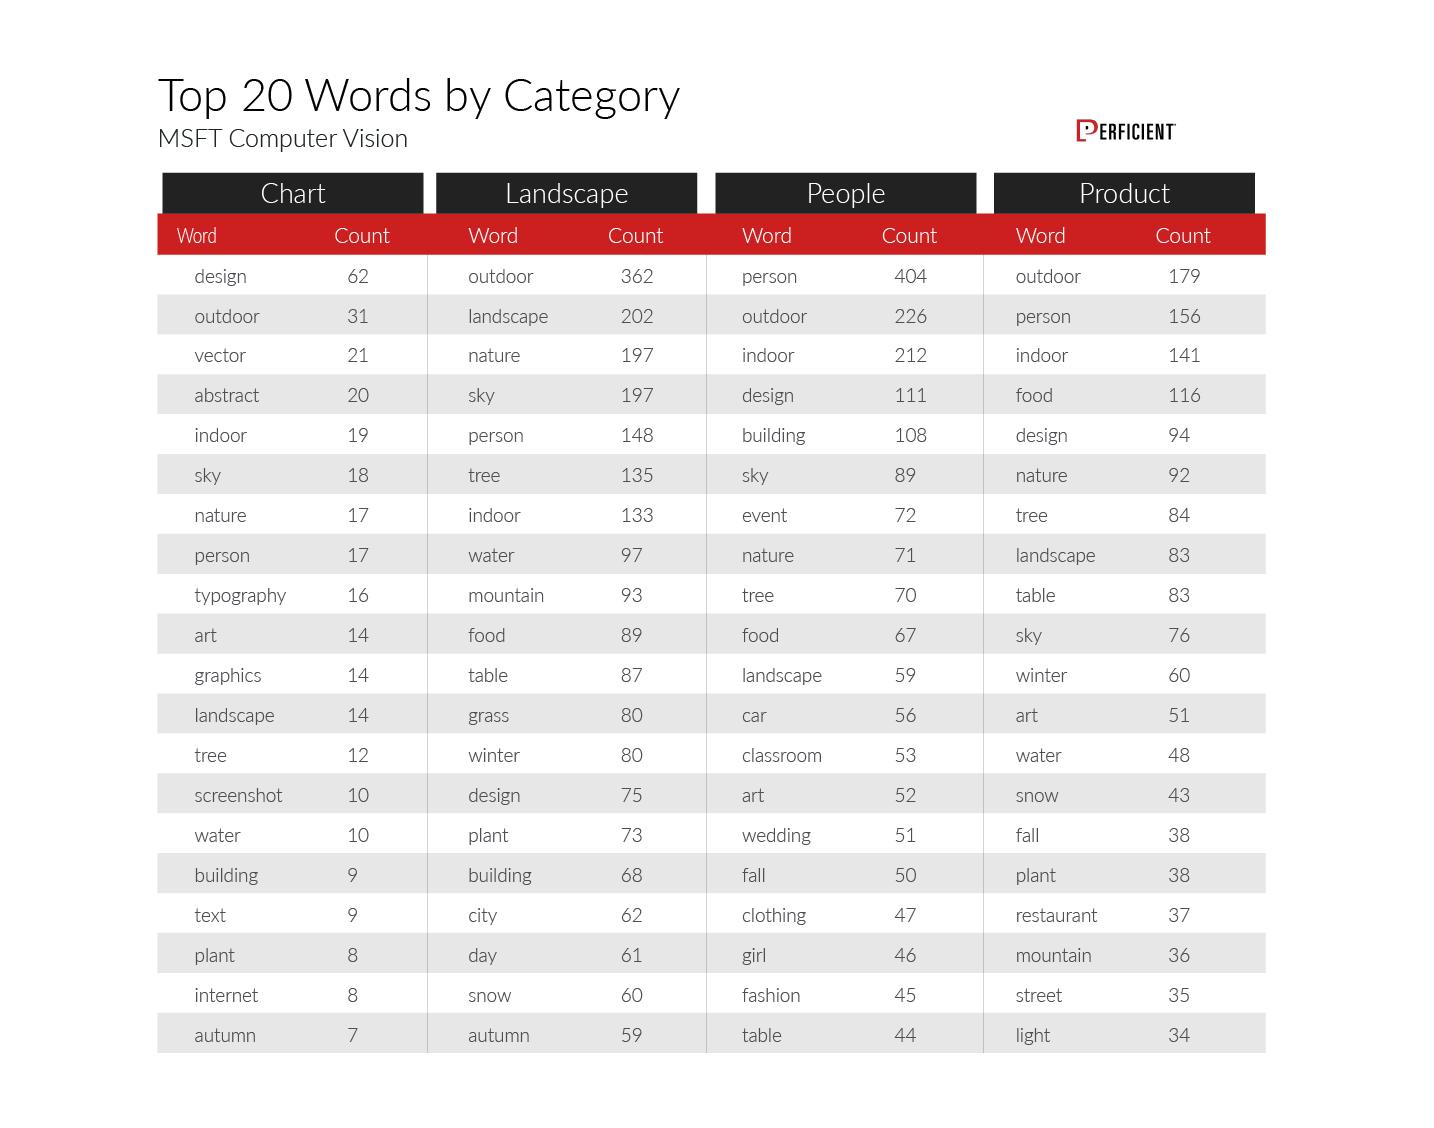
One of the interesting findings of our research was how the vocabulary of the different engines varied. Here is the raw data for the four platforms, as well as our 'human hand-tagged' results:
Of course, it's natural that the vocabulary varies depending on the image type (detailed data on that follows). Here is what we saw for human hand-tagged results:
Amazon AWS Recognition:
Google Vision:
IBM Watson:
Microsoft Azure Computer Vision:
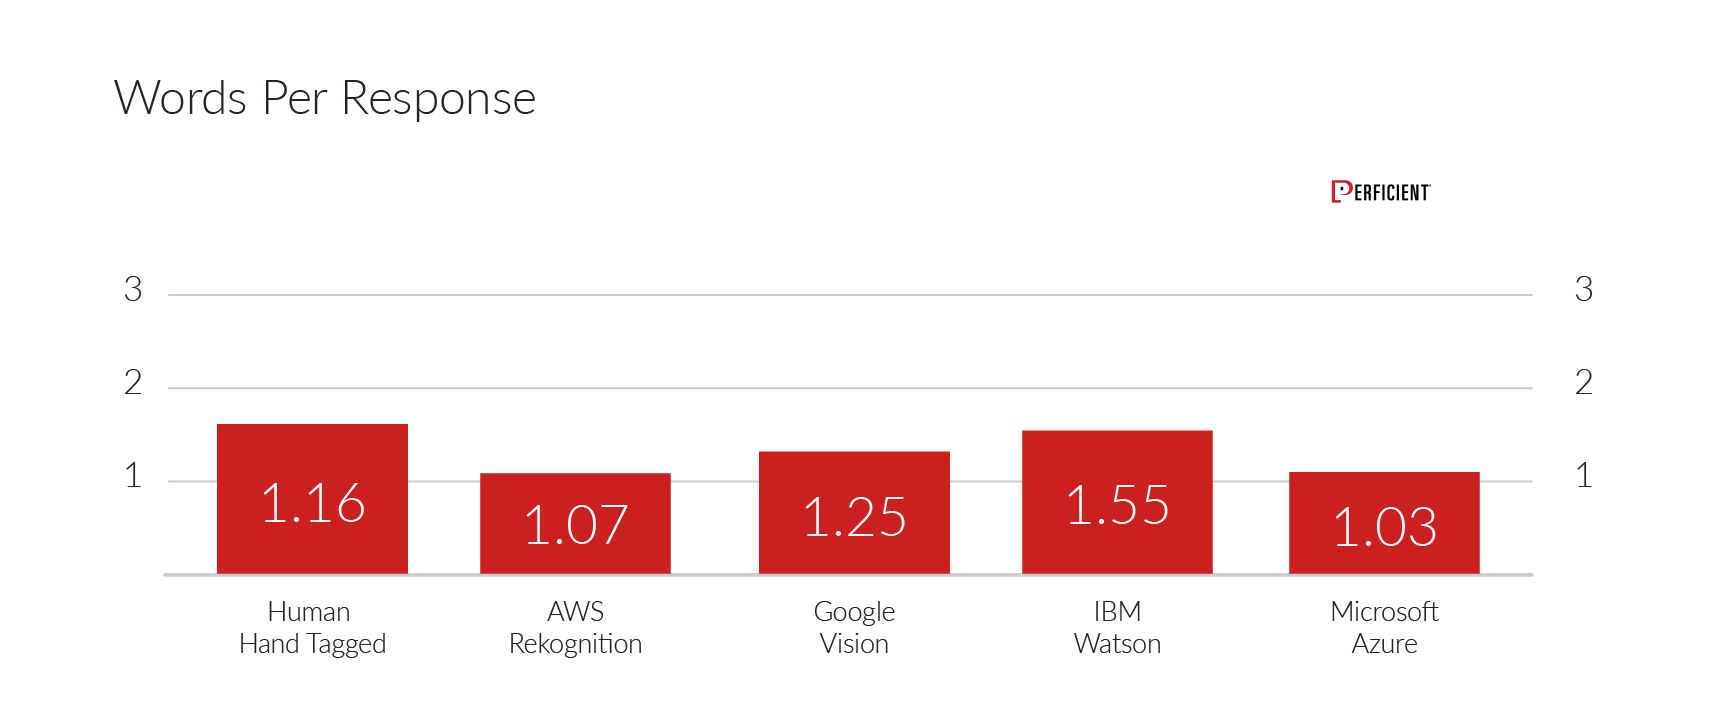
As you look at the above data, you'll note that we broke the data down to the individual words, but of course, many of the tags were comprised of more than one word. In addition, the average word length of tags varied to some degree by engine, as well. Here is the average number of words per tag:
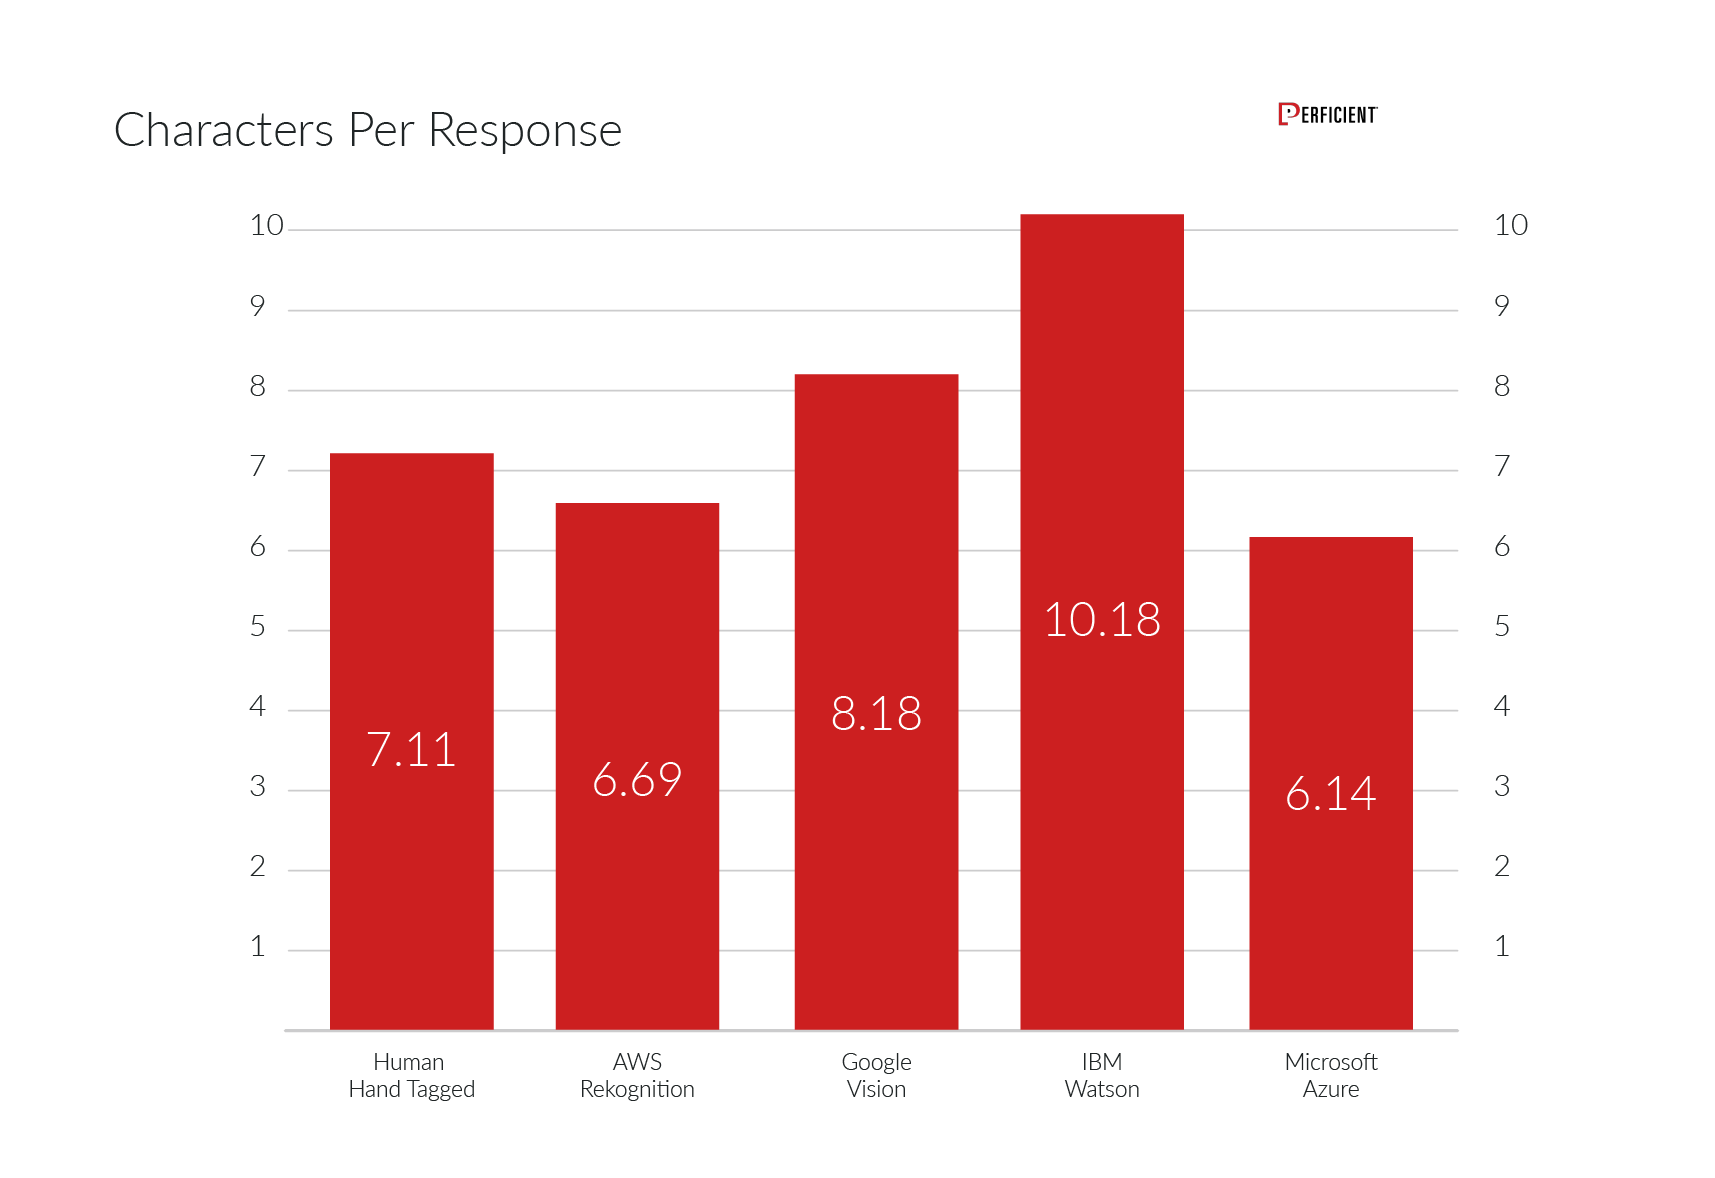
Finally, here is the data on the average number of characters per response for each image recognition engine:
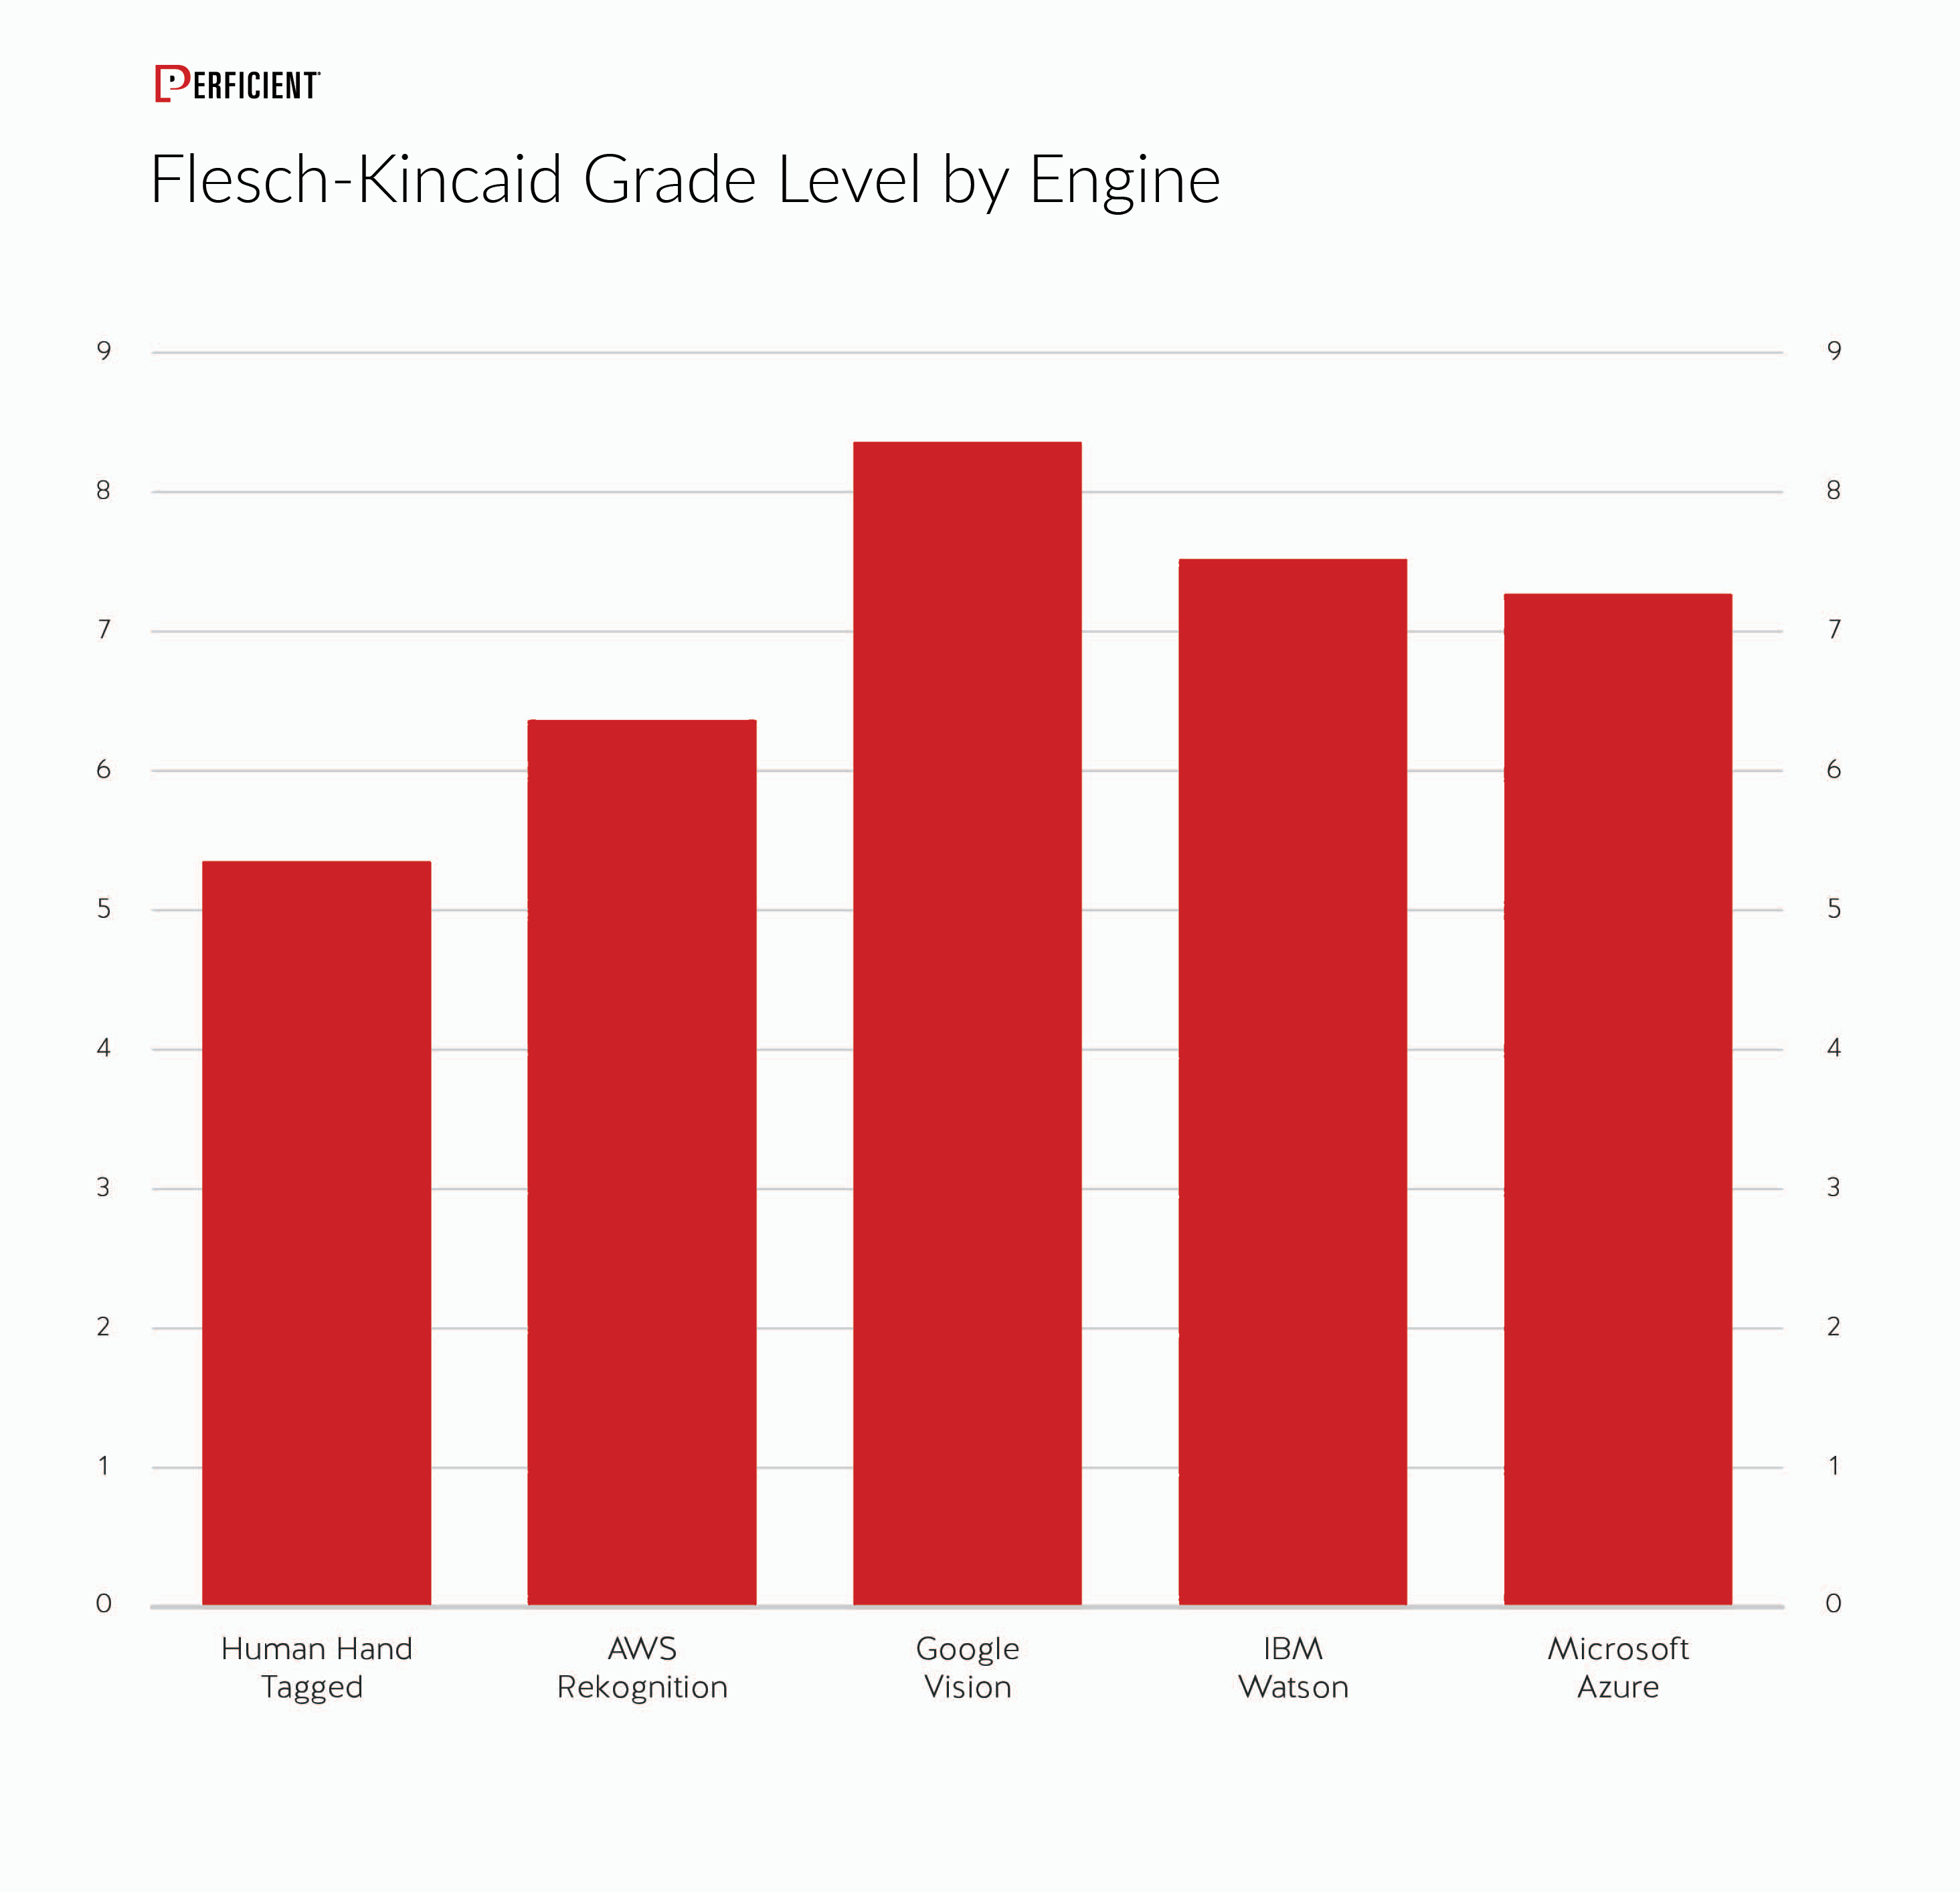
Grade Level for Each Engine
Google Vision and IBM Watson are the biggest nerds (using 10-dollar vocabulary words).
*Grade level provided by Datayze
All of the engines have a long way to go to develop the capability of describing the images in the way that a human would.
Other Observations
Watson loves colors: The IBM Watson API comes up with the most unique color variations and has the most colors in all checks. Some of the colors in the IBM Watson rainbow include:
- Alizarine red, dark red, claret red, indian red
- Reddish orange, orange
- Lemon yellow, pale yellow
- Jade green, ‘greenish’ color, sage green, sea green, olive green, bottle green
- Steel blue, blue, electric blue, purplish blue
- Indigo, tyrian purple, reddish purple
- Ash grey
While Google Vision and Microsoft Azure Computer Vision mention “yellow” quite plainly, neither matches Watson for sheer artistic flourish.
Microsoft Azure Computer Vision could describe image quality: the engine returns results for “blur” and “blurry” as well as “pixel.”
“Doing” words: IBM Watson had 112 responses that ended with “ing,” Amazon AWS Rekognition had 62 responses, Microsoft Azure Computer Vision had 87 responses, and Google Vision had 103 responses.
IBM Watson loves highly descriptive words: And adding context to them: 'pinetum (area with pine trees),' 'oxbow (river),' 'LED display (computer/tv),' 'rediffusion (distributing),’ 'arabesque (ornament),' 'dado (dice),' 'alpenstock (climbing equipment).’
In fact, IBM Watson is extremely descriptive of images in many ways. This is likely what leads to some of the accuracy challenges that IBM Watson faced. On the positive side, this increased focus on highly descriptive words should make it easier for users to find relevant images related to their queries (a greater variety of tags will create more connections that users might make).
AWS Rekognition is a fashionista: Amazon AWS Rekognition loves clothing. It recognized shorts, pants, and shirts much more than the other APIs.
Google loves cats, IBM Watson loves dogs: Google recognized cat breeds and IBM Watson recognized dog breeds, and got much more specific about them, going so far as to identify the specific “German short-haired pointer dog.” Microsoft Azure Computer Vision was second behind Google Vision in focusing on cats.
Amazon AWS Rekognition engine was strongly biased towards products.
Summary
Google Vision is the clear winner among the image recognition engines for both raw accuracy and consistency with how a human would describe an image.
IBM Watson finished last in these tests, but we should note that IBM Watson excels at natural language processing, which was not the focus of this study. It is the only major AI vendor to date that has built a full GUI (known as Watson Knowledge Studio) for custom NLP model creation, and its platform allows not only classification but custom entity extraction through this GUI.
It's also fascinating to see that three of the four engines score higher for raw accuracy than human hand tagging when the confidence level is greater than 90%. That's a powerful statement for how far the image recognition engines have come.
But, when we focus instead on how well the engines do in labeling images in a manner similar to how humans would describe them, we see that they still have a way to go.
Additional Resource
Smart Images AI Evaluator is a resource developed by Perficient Digital that allows you to upload any image and see how the image recognition engines from Adobe*, Google, IBM, and Microsoft tag that image.
*Please note that Adobe was not included in this study. The study includes Amazon which is not one of the engines supported in the Smart Images AI Evaluator.
Google Vision is the clear winner among the image recognition bots engines.
Detailed Methodology
This section reviews both the collection, ranking, and scoring processes used.
The Image Collection Process
Two humans collected and tagged 2,000 images in four distinct categories. Each category has approximately 500 images. Images were collected and tagged from November 30, 2018 through January 8, 2019.
- People
- Landscapes
- Charts
- Products
Each human came up with and assigned five tags to describe each image. We then ran all 2,000 images through each of the following image analysis APIs (images were processed by APIs at the same time, on January 21, 2019).
- Amazon AWS Rekognition
- IBM Watson
- Google Vision
- Microsoft Azure Computer Vision
The results were a unique set of labels/tags for each image from each API. The confidence metric of each API was then applied to identify the top five most confident labels for each image.
Two Ranking Systems
A database with a UI interface was created, which presented each individual image along with its associated complete set of human- and API-generated tags. This allowed humans to rank the tags. The humans did not know which tags were generated by APIs or humans.
Two ranking systems were used. The first focused on identifying the image recognition engine-supplied tags that best aligned with the way that humans would describe the image (“Matching Human Descriptions Evaluation”). The second ranking system focused on identifying whether the tags returned by the image recognition engines were accurate, even if it was not something that humans were not likely to use in describing them (“Accuracy Evaluation”).
The Matching Human Descriptions Evaluation
In the first ranking system, a different group of three humans, representing different age groups and genders, used the interface to rank the images. Each individual was presented with the image and the top five labels collected from each API, including the “Human” API. The rankers were then tasked with selecting and ordering the best five descriptors for the image. When two or more tags were similar, graders chose the best version of that label to describe the image.
This approach was focused on the Matching Human Descriptions Evaluation. This ranking process was completed February 4-11.
When two or more tags from different sources (human or API) were the same, they were combined into the same label and displayed as one choice within the grader interface. If selected, the same score was applied to each of the API sources that supplied that exact tag.
Each “place in rank” – one through five—was assigned points. Those points were used to grade each image API, with the “Human” API as a reference point. Points were then assigned as follows:
- rank 1 = 100
- rank 2 = 80
- rank 3 = 60
- rank 4 = 40
- rank 5 = 20
The number of tags collected from each source:
- Human: 14,000
- Amazon AWS Rekognition: 24,859
- IBM Watson: 19,398
- Google Vision: 16,629
- Microsoft Azure Computer Vision: 16,874
The Accuracy Evaluation
The second ranking system for Accuracy Evaluation entailed three humans rating 500 of the 2000 images purely for tag accuracy. All of the tags from each API and the humans were displayed in a UI next to the image. As with the Matching Human Descriptions Evaluation, all of the tags were anonymized. Each tag was tagged as either:
- Accurate
- Inaccurate
- Unsure
When each and every tag for the image was assigned a value, the next image was presented. This ranking process took place from April 12, 2019 to May 9, 2019.

