What Is the Impact of Core Web Vitals on Ranking?

Google's Page Experience Update began rolling out on June 15, 2021 and was completed on September 3, 2021. One big question many have is: How big of a ranking factor is it? On August 6, Google's John Mueller weighed in on Reddit:
“It is a ranking factor, and it's more than a tie-breaker, but it also doesn't replace relevance.”
We set out to discover the real story.
This study captured the rankings for the top 20 results across six industries for 200 keywords each. The industries we tracked were healthcare, technology, finance, home improvement, ecommerce, and energy. The Core Web Vitals (CWV) scores for each of the ranking pages were also captured. These measurements began prior to June 15, 2021, and our final measurements were taken after September 3, 2021 (detailed methodology is covered below ).
How big of a factor is CWV? In short, our study confirms what Mueller said on Reddit: It's not a large factor at all. However, Google cares about CWV and Page Experience because you can have the most-relevant and highest-quality content on the planet, but it doesn't matter if the user can't effectively access it.
Read on to see the details of our analysis, along with industry-specific data.
Note: If you're not familiar with the update, read what Google had to say about it, and get more information from Search Engine Land and Search Engine Journal.
How Did the Industry Respond?
The major journals that cover search — such as Search Engine Land, Search Engine Journal, and Search Engine Roundtable — all echoed Google’s messaging that the expected impact would be small. Yet, this messaging seemed to be received differently by several publishers of websites.
We spoke with a number of companies that prioritized CWV but did not address other core SEO needs. It was almost as if Google was trying to whisper a message about the update, and it passed through two levels of maxed-out amplification before anyone heard it.
The good news is that even if the CWV component of the Page Experience ranking signal is weak, improving overall page speed pays off in terms of user experience and potential conversion rates. Regardless of whether rank is significantly impacted, improving CWV will likely be beneficial for your business.
Improving overall page speed pays off in terms of user experience and potential conversion rates.
Did Google Make the Web Faster?
While our data sample is small compared to the entire web, the short answer to this question appears to be yes. First, let's look at the data for First Input Delay (FID) and Largest Contentful Paint (LCP).
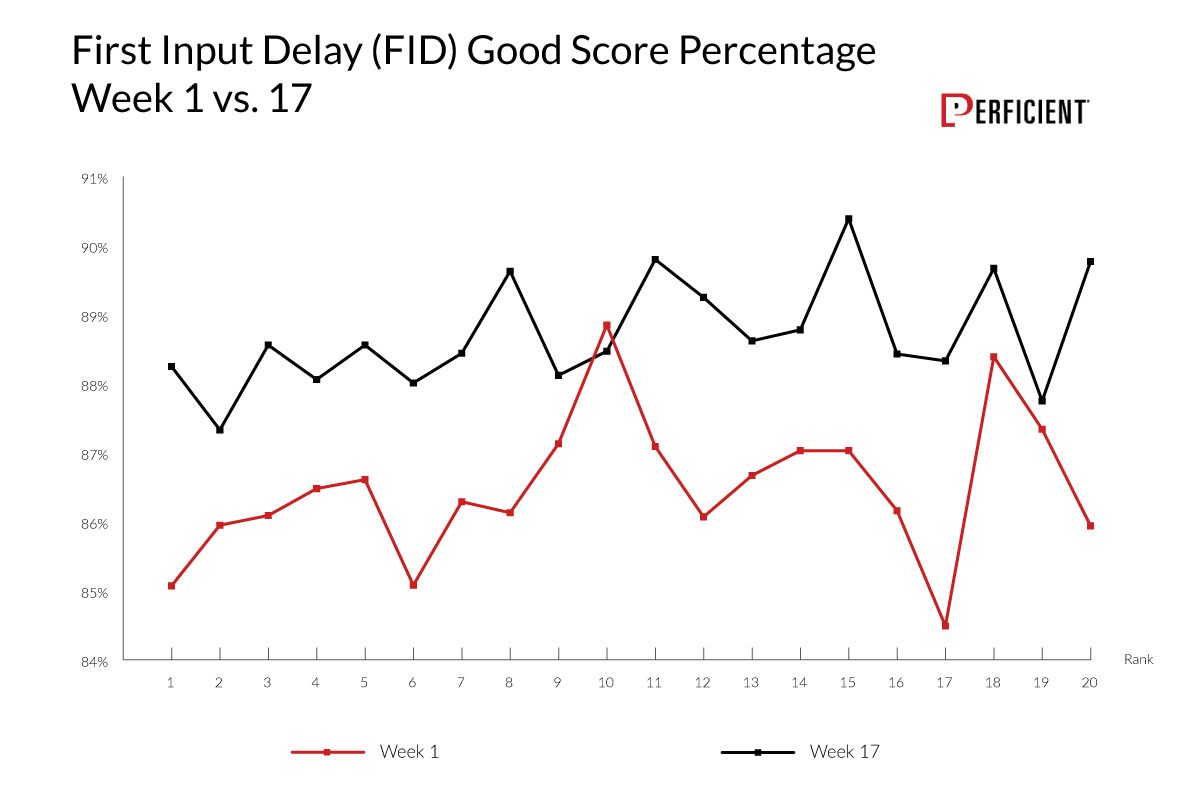
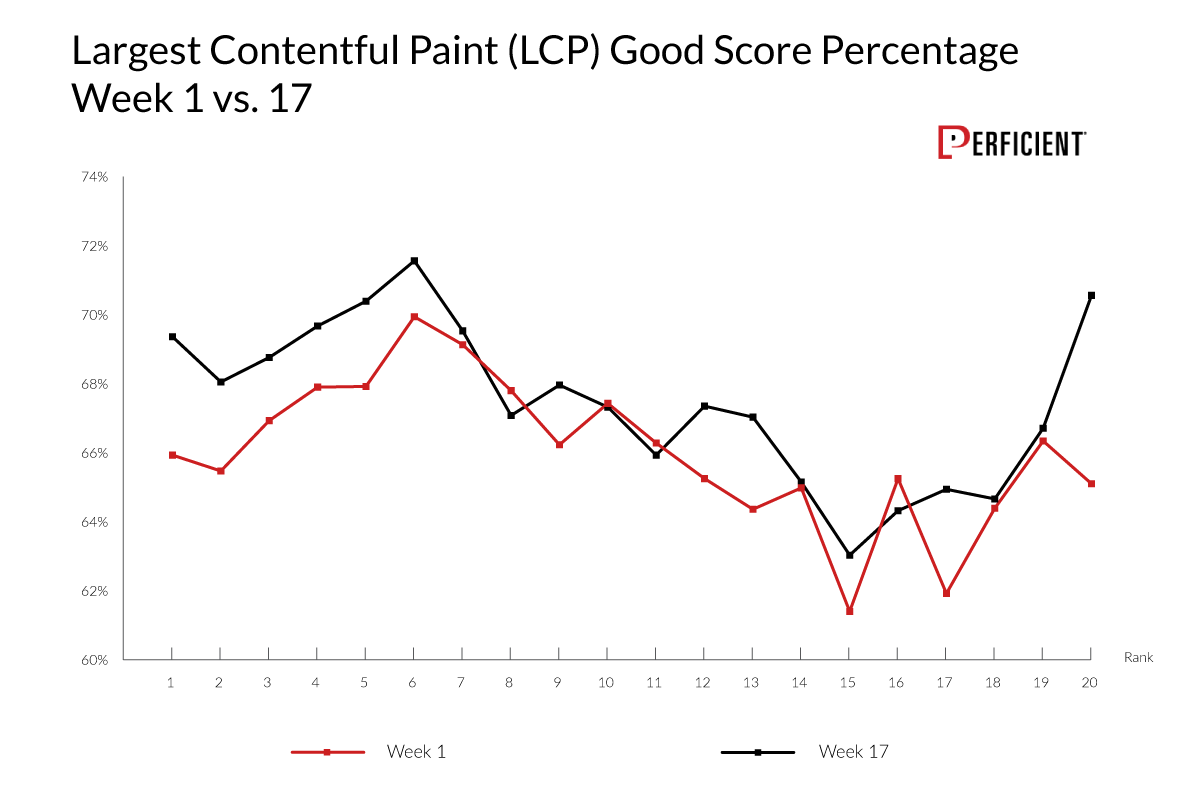
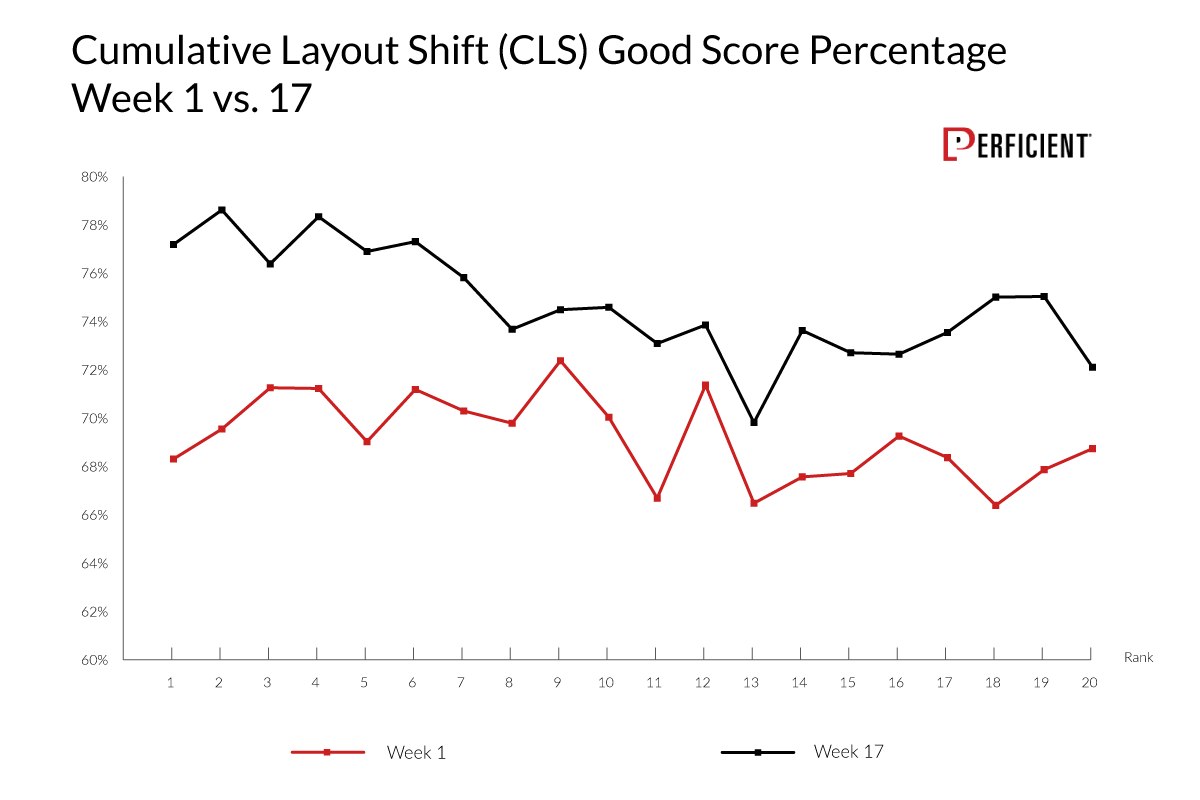
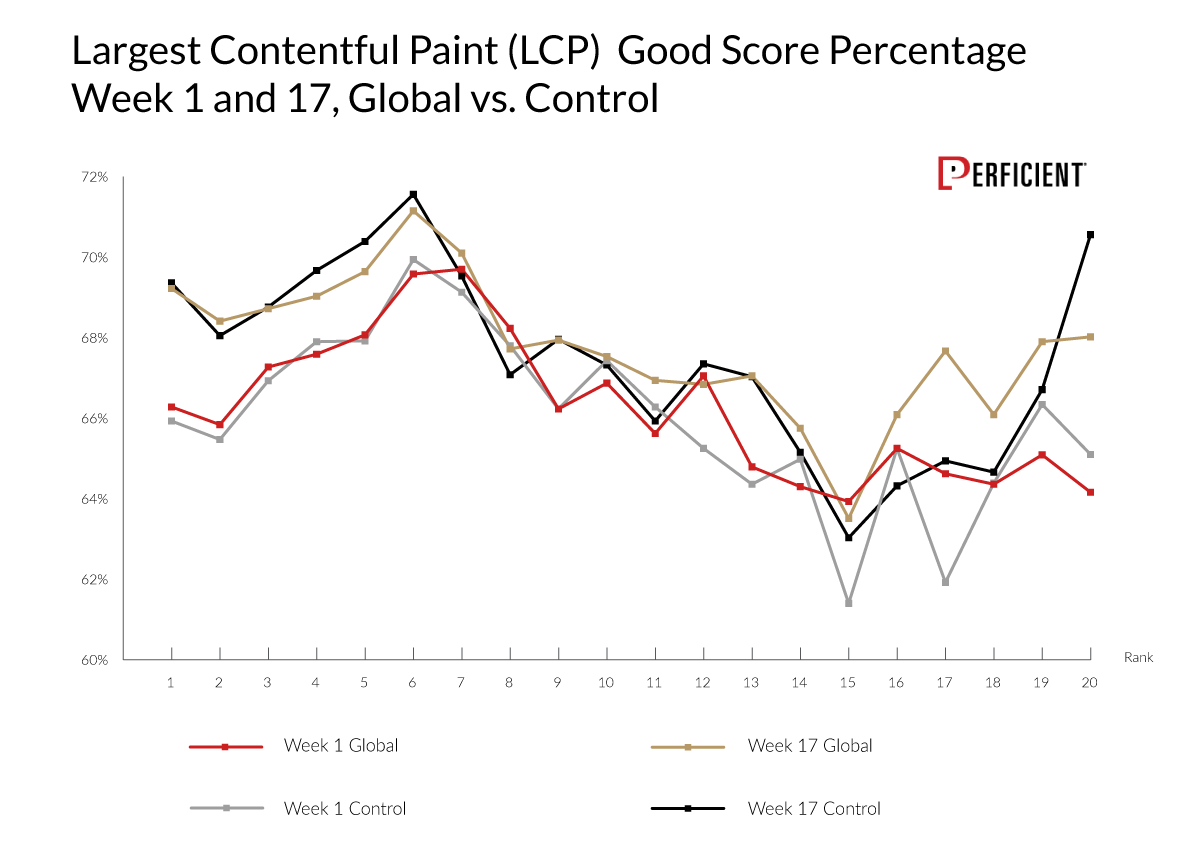
The first three charts show the percentage of pages that received a "Good" score in Lighthouse Tools by ranking position. The two data lines represent week one of our study (before the Page Experience rollout started) and week 17 of our study (after the rollout was complete). The set of URLs in these charts are specific to our control group of URLs, meaning we looked at the same set of URLs.
FID measures how quickly a browser can respond to a user’s action. If the browser is tied up executing background JavaScript when the user clicks on a page element, there can be some latency before it can respond to the user request.
Here is what we saw:
Except for URLs ranking in position 10, the overall scores went up consistently by a few percentage points.
LCP measures how long it takes for the largest content object in the main viewport to render. As this chart shows, the story here is a bit muddled:
It's clear that several pages did speed up their LCP scores, particularly in ranks one through six and position 20. Not much progress was made for the rest of the ranking positions.;
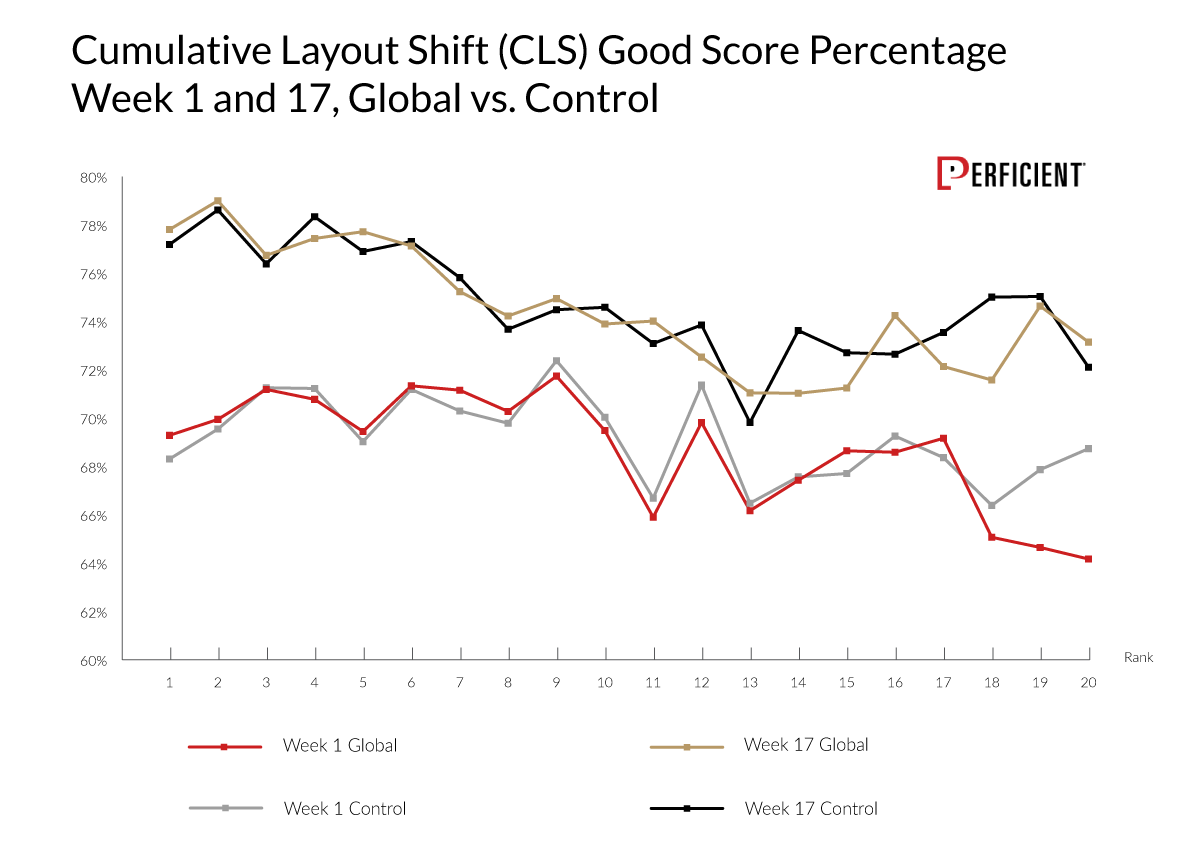
Our third CWV metric is Cumulative Layout Shift (CLS). Strictly speaking, this is not a measure of speed. It measures how webpage elements shift during rendering. The movement of page elements is undesirable. Since users may try to click on something while a page is rendering, it can be frustrating if the page shifts as you're trying to do that.
CLS is the CWV metric that saw the most dramatic movement, with the percentage of pages reporting a “Good” result going up by almost 10% in position one.
How Much of a Ranking Factor Is Core Web Vitals?
To track this, we combined two measurements: how the CWV scores improved by ranking position and how much the general web ecosystem improved their scores.
This was the reason for our control group of URLs. Instead of only examining the CWV score by ranking position, the control group revealed whether any CWV scores by ranking position improved simply because everyone improved their CWV scores.
We wanted to see if any apparent increase in the CWV scores for the top 20 positions was due to increases of all the websites, rather than it being due to the weight of CWV components as a ranking factor.
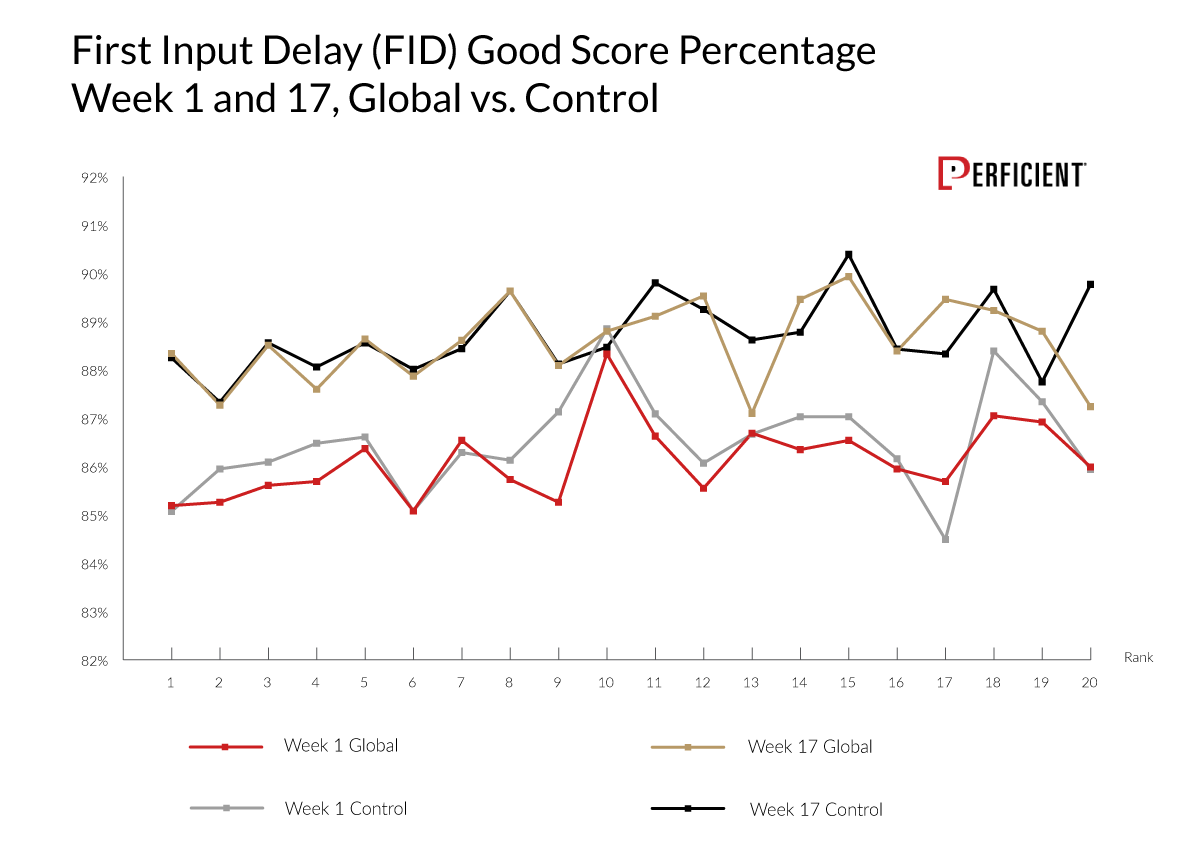
To evaluate that, we tracked the CWV scores for the top 20 SERPs across our query set for weeks one through 17. In our charts showing this data, we also overlaid the CWV scores data for our control group.
Here is what we saw for the FID scores:
As you can see, it appears the FID scores of the top 20 ranking positions increased, but no more so than the CWV scores for the control group.
Let's look at the LCP scores for the same data set:
Once again, the scores for the top 20 ranking positions closely follow that of our control group.
For our final CWV score, let's examine the CLS scores for this group of URLs:
We're three for three, with all three metrics showing nearly identical behavior across both the test set and the control group.
Does this tell us the CWV signals are not a ranking factor? That’s not what we see here. The data confirms CWV scores are not a large ranking factor, just as Google has been telling us. It shows a general correlation between pages with higher CWV scores and rank, but the rollout of the Page Experience update did not change the shape or scope of that correlation to any noticeable degree.
The data shows a general correlation between pages with higher CWV scores and rank, but the rollout of the Page Experience update did not change the shape or scope of that correlation to any noticeable degree.
Bonus: CWV Scores by Market Segment
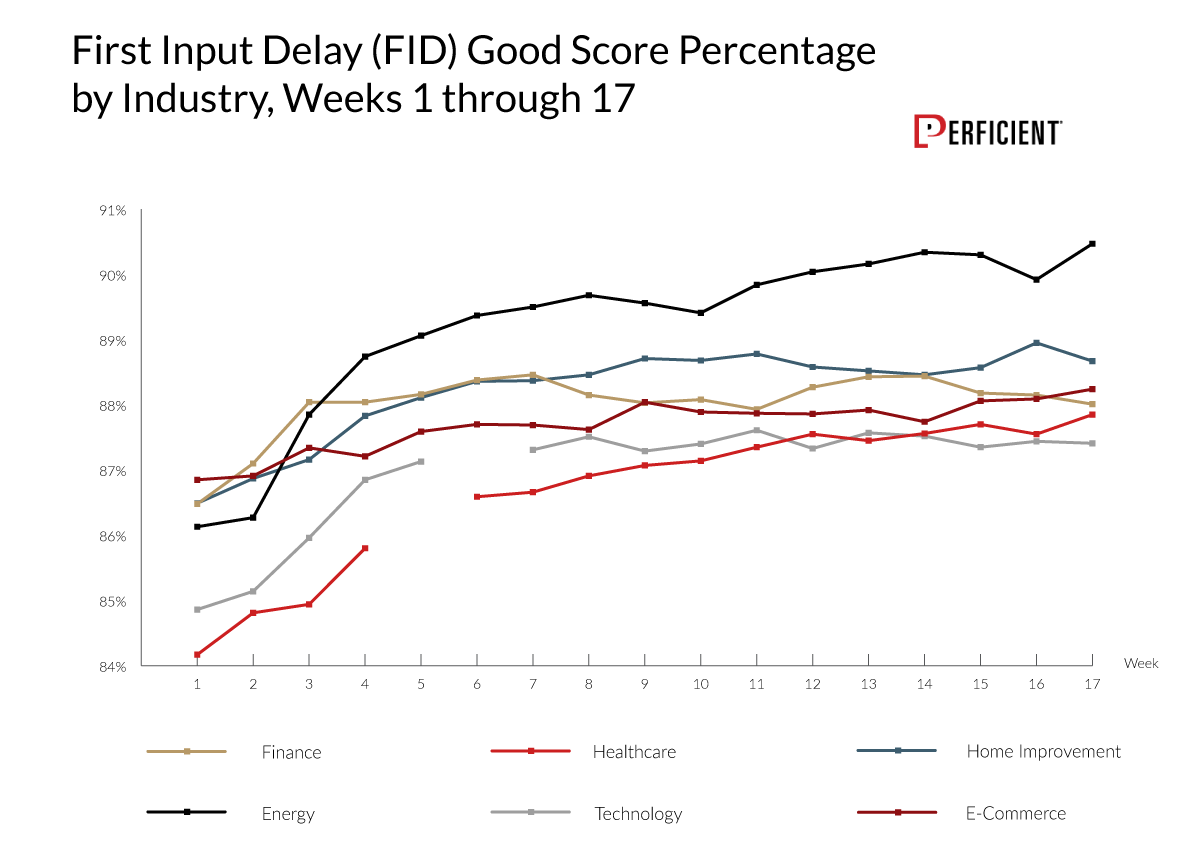
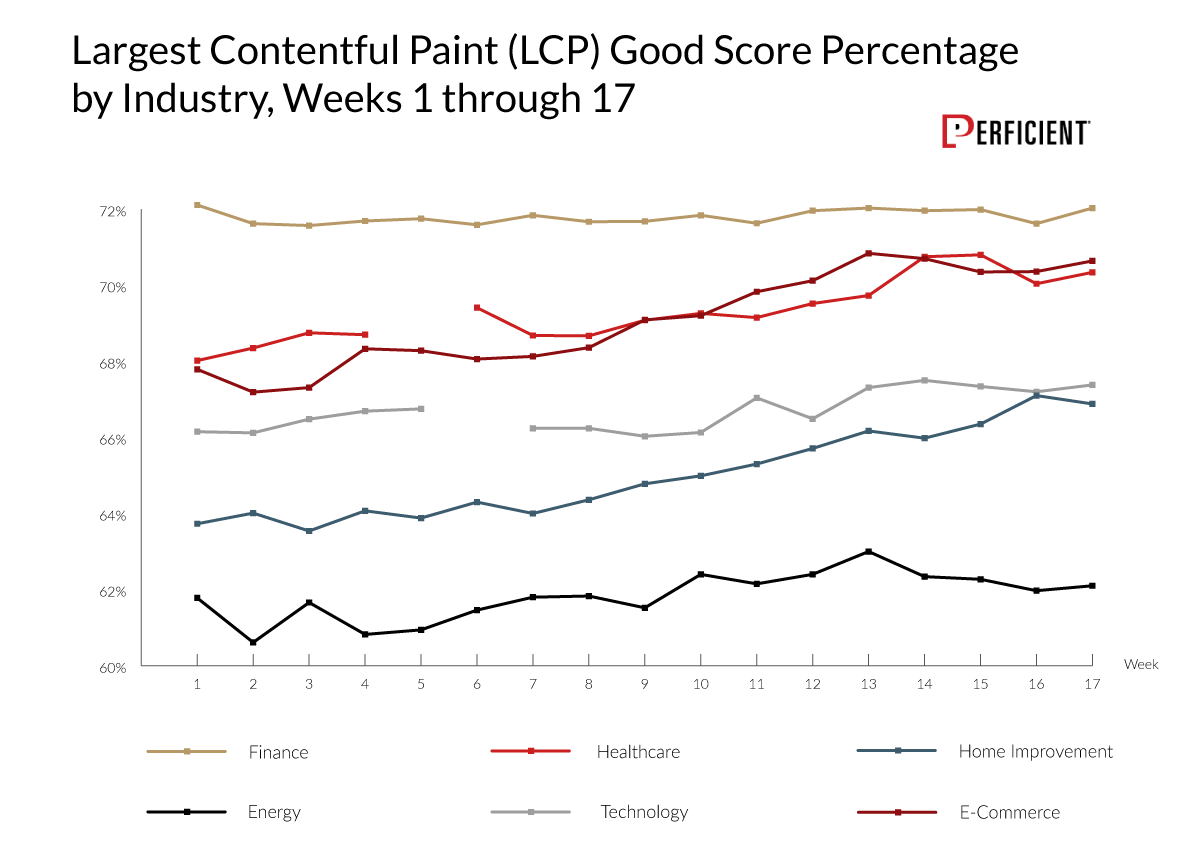
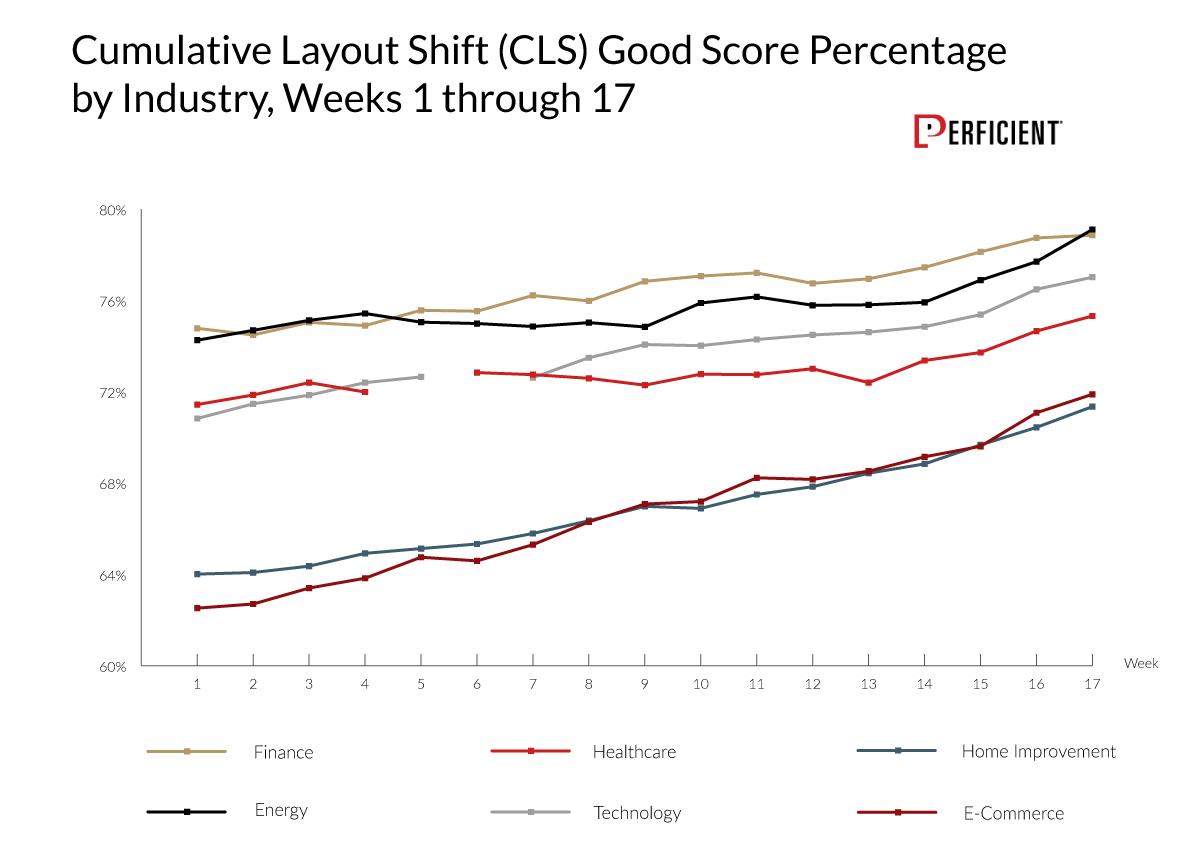
We drew our test query into six market segments: ecommerce, energy, finance, healthcare, home improvement, and tech. Note: Tech and healthcare have a one-week gap in the data due to a collection error.
Here is what we saw for their FID scores:
It looks like sites across all six industry segments improved their FID scores.
Next, let's examine the LCP data:
The percentage of pages returning a “Good” score for this metric increased for every market segment except finance. However, the percentage of good scores was already high, leaving little room for improvement.
For our final data set, let's see what happened with the CLS scores by market segment:
The percentage of “Good” CLS scores across all the tracked SERPs saw a steep climb throughout the study’s 17-week period. It's clear from our data that many people worked on this across each market segment.
Also of interest is that markets that performed very well for one metric didn’t necessarily do the same for the others. Finance and energy were leaders for CLS, but finance was in the middle of the pack for FID and the clear leader for LCP. Additionally, energy led FID and was last for LCP.
Summary
Our data confirms what Google has been telling us: CWV scores are not a large ranking factor. Content relevance and quality remain the most important ranking factors, as they should.
However, this should still matter to anyone who publishes or operates a website for reasons that go beyond the SEO benefits. Sites with faster pages get more user engagement and higher conversion rates.
From Google's perspective, the reason they care is also clear. Google wants to serve the best possible results to its users. Offering a quality service keeps usage high and drives ad revenue.
While much of its algorithm seeks to identify the site with the best content to put in the SERPs to meet the user needs related to a given query, this has little to no value if the users have a bad experience on the site containing that content.
Expect that Google's investment in CWV and Page Experience will continue to grow over time. You may see increased strength of some signals and new signals added into the mix. The concept of Page Experience and CWV scores within that will continue to be part of the landscape and will continue to grow.
Detailed Methodology
Core aspects of how we performed the analysis:
- We monitored the top 20 positions for 1,188 unique keywords.
- These were broken into six market segments: ecommerce, energy, finance, healthcare, home improvement, and technology.
- These SERPs were tracked from June 7, 2021, to September 27, 2021 (weeks one through 17 in this post).
- We monitored the CWV score for each ranking URL in Lighthouse Tools, which included Cumulative Layout Shift (CLS), First Input Delay (FID), and Largest Contentful Paint (LCP). Our analysis focused on CLS, FID, and LCP, as Google identifies these as ranking factors.
- Scores are generally shown as the percentage of URLs returning a "Good" score. For example, a score of 72% for LCP for position six in the SERPs for week one means the percentage of URLs ranking in position six that returned a “Good” result across all sampled keywords was 72%.
We broke our URL sets down in two ways:
- The first set was based on tracking the URLs ranking in the top 20 positions for each keyword. For each ranking URL, we tracked their ranking position and CWV scores. We considered this our test dataset to track how CWV scores improved across the ranking pages.
- The second set of 7,623 URLs consisted only of those that persisted in our dataset throughout the study. For this, we also tracked their ranking positions and CWV scores. We used this as our control group to evaluate if any gains we saw in the test dataset were driven by general improvements in CWV scores rather than an increase in the weight of CWV metrics as a ranking factor.
